So we are closing in on the end of the European session and it is time to take a second look at the bitcoin price in an attempt to figure out how we can put together a strategy going forward to help us draw a profit from any volatility.
We have had a pretty up-and-down day in the markets and this means we are probably going to see a certain degree of choppiness as we head into the session tonight.
If this is the case, we are going to need to put some pretty tight stop losses in place so as to avoid getting chopped out to any substantial degree as and when things move. It doesn’t really alter our approach too much but it does make things a little bit more stringent from a risk management perspective than might otherwise be the case.
So, with this noted, let’s get some levels on paper.
As ever, take a quick look at the chart below before we get started so as to get an idea where things stand and where we are looking to jump in and out of the markets according to the rules of our intraday strategy. It is a one-minute candlestick chart and it has our range overlaid in green.
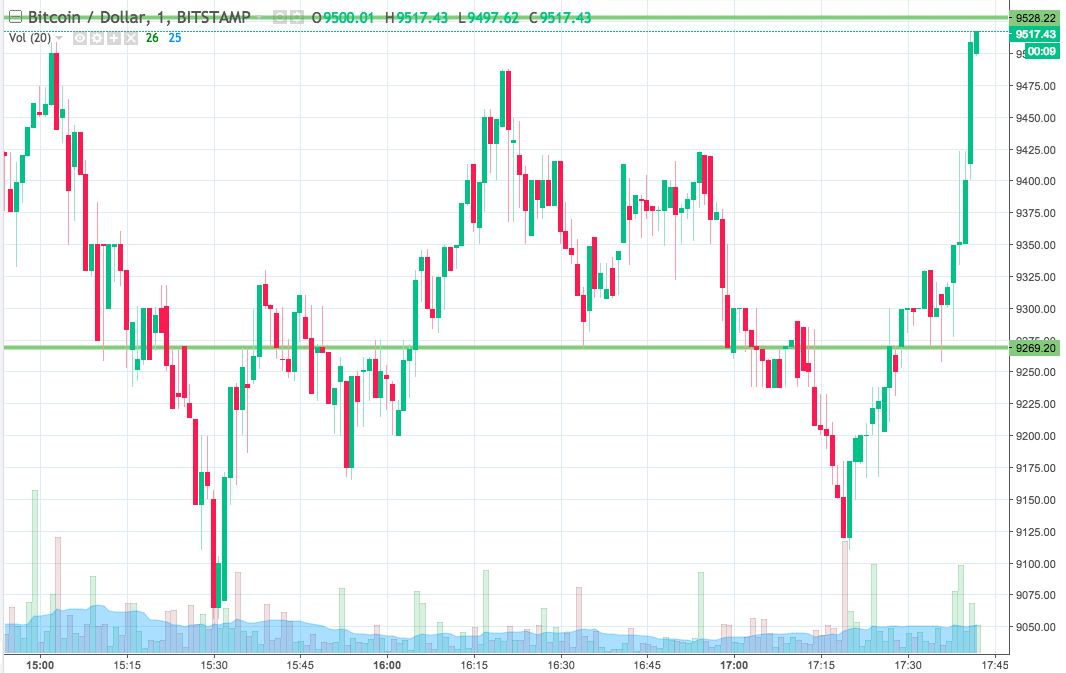

As the chart shows, the range we are looking at for this evening comes in as defined by support to the downside at 9269 and resistance to the upside at 9528. If we see price breakthrough the former, we will enter into a short trade with an immediate downside target of 9200. Looking the other way, to the upside, if price closes above resistance, we will enter long towards a target of 9600.
A stop loss on the first position around 9285 and on the second somewhere in the region of 9505 will keep risk tight.
Charts courtesy of Trading View