

So yesterday we noted that the bitcoin price was weaving its way through an upwards sloping channel, and further, that we would use this channel to help us figure out our strategy as we headed into last night’s Asian session. In traditional technical analysis when looking at equities, forex etc., a channel can mean two things. The first, that the price of the asset in question is consolidating after a particular move (in this instance, to the upside) as speculators take profits off the table. In this case, we generally see a resumption of the overarching trend (again, in this instance, to the upside) once the long market participants have exited their positions. Second, that the momentum of the prior move has dried up, and the opposing buyers or sellers (in this case, the sellers) are piling into positions. In this situation, we will often see a reversal.
How do we know which is which? We use a breakout approach, with the levels that define the channel as our entry signals. If after a period of channel trading, post-upside run, the price of an asset breaks through channel resistance, we can assume it is scenario one and that there is further upside left to run. As such, we can enter long.
Conversely, if price breaks support, it’s scenario two (after an upside run, that is) and we enter short.
The second of these two scenarios came to fruition last night, and we entered short on the break with a target of 400 flat. Having taken out our target, the bitcoin price then broke further to reach overnight lows of 394 flat, and this level will feature in today’s strategy. So, as we head into today’s European session, where are we looking to get in and out of the markets, and what does our risk placement look like? Take a quick look at the chart below to get an idea of our key levels.
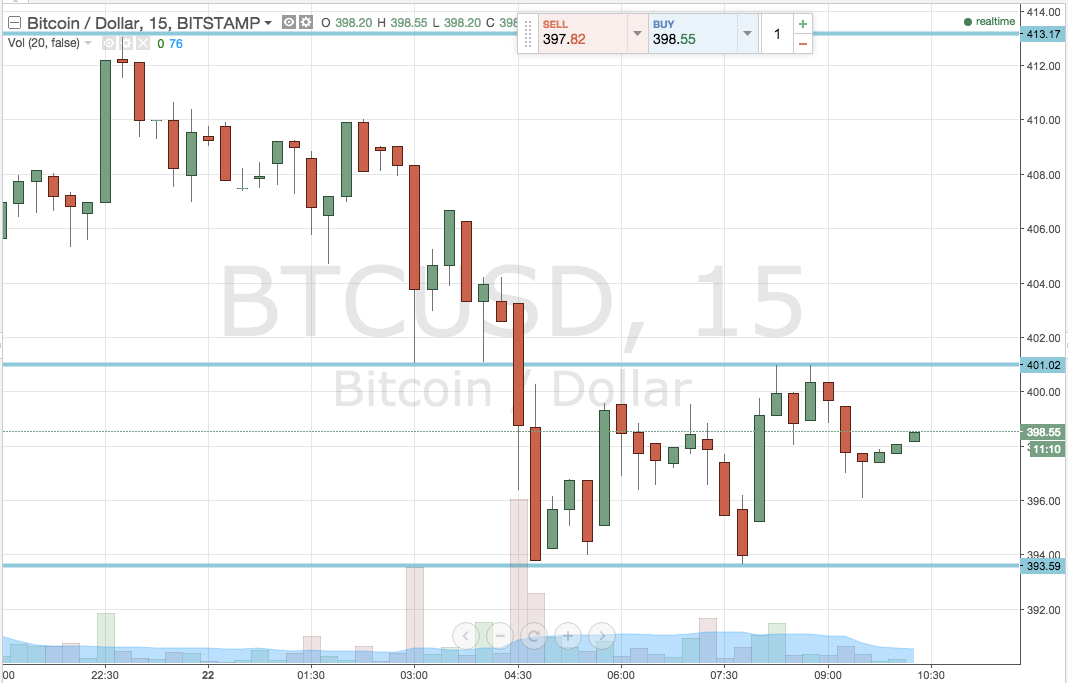

As the chart shows, the levels we are looking at in today’s session are in term support at the aforementioned overnight lows (394 flat) and in term resistance at the most recent swing high – 401 flat, a level to which we corrected upwards post-lows. These tow levels define today’s range.
Now to our strategy. Traditional breakout first. A close above in term resistance will put us long towards an initial upside target of 413.17. This is pretty aggressive, so if you are looking for a more conservative entry, a target of 407 works well. A stop loss in either scenario somewhere around 398 keeps things tight from a risk management perspective.
Looking to the downside, a break (and a close) below in term support will put us short towards 385 flat. Again a stop is required, and somewhere around 396 looks attractive.
From an intrarange perspective, we’ve not got too much to play with, but this doesn’t take it off the table. If we bounce from support, we will enter long towards resistance with a stop just one or two dollars south of our entry. Reverse the trade on a correction from resistance.
Charts courtesy of Trading View