The week is pretty much over now and it’s time to take a look at how action over the last three or four days has brought us to where things trade right now in the bitcoin price in an attempt to try and figure out a strategy moving forward into the European session today and, beyond, into the late US session this evening.
Anybody who has been with us all week will know that we have relished in the volatility that price has presented us this week, given the fact that said volatility often serves up plenty of opportunities to jump in and out of the markets according to the rules of our intraday strategy.
However, it can be a double-edged sword.
Sometimes, when we get volatility like this, it is choppy enough to mean that we get repeated stop loss hits and – in turn – get pushed out of the market frequently.
So, the hope is that we will see continued volatility but also some sustained momentum post-breakout, which will allow us to clear some nice trades as the session matures today.
With this in mind, let’s get some levels in place that we can use going forward. As ever, take a quick look at the chart below before we get started so as to get an idea where things stand and where we are looking to jump in and out of the markets according to the rules of our intraday strategy. It is a one-minute candlestick chart and it has our range overlaid in green.
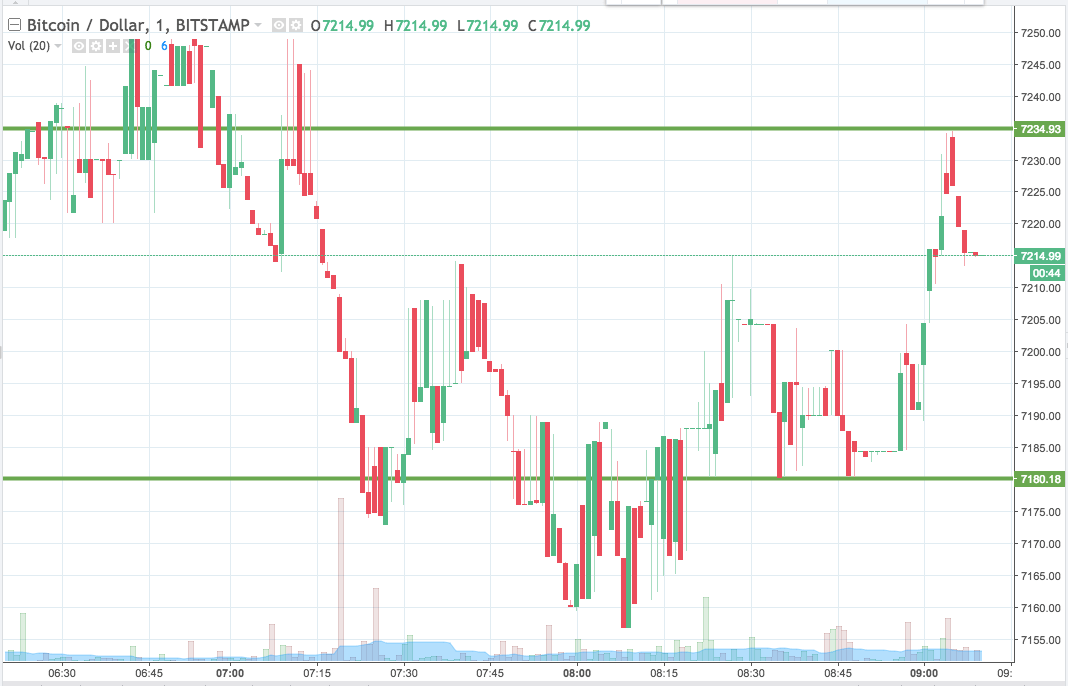

As the chart shows, the range we are looking at for the session today comes in as defined by support to the downside at 7180 and resistance to the upside at 7234.
We will enter long on a close above resistance towards a target of 7260. Conversely, we will enter short towards a downside target of 7130 if we see a close below support. Stops on both positions will ensure we are taken out of the trades if things turn against us.
Charts courtesy of Trading View