We’re closing in on the end of the week new, and there’s been an overarching trend in the bitcoin price all week. Well, more accurately, the trend has been a lack of a trend. Price has remained relatively flat, and confined between the 1100-1200 region, and we haven’t really seen anything substantial in terms of breakout activity. We’ve had a couple of up and down trades, and we’ve had a few reasonable entries, but nothing we could really get behind long term.
Like we always say, however, a profit’s a profit, and if we’re looking at closing out the week net positive, we’re going to do it with a smile.
So, let’s see what we can set up for today, and see if we can get that little bit closer to a positive finish line cross. As ever, take a look at the chart below to get an idea of what’s on before we get to the detail. The chart is a five-minute candlestick chart, and it’s got our range overlaid in green.
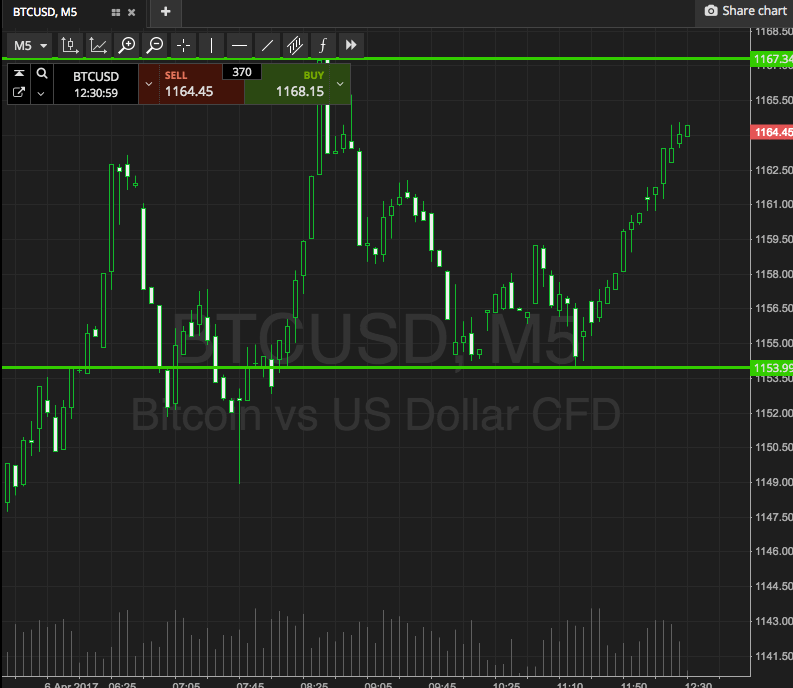

As the chart shows, the range we are looking at using for the session today is defined by support to the downside at 1153, and resistance to the upside at 1167. There’s plenty of room for intrarange on this one, so we’ll look at getting in to a long position on a bounce from support, and a short entry on a correction from resistance. If we see price close above resistance, we’ll be looking at getting in long towards an immediate upside target of 1180. A stop on the trade at 1163. Conversely, if we see the bitcoin price close below support, we’ll look to get in short towards 1140. Again we need a stop loss, and somewhere in the region of 1156 looks good.
Let’s see what happens.
Charts courtesy of SimpleFX