That’s the week done in the bitcoin price, and for our final analysis of the week, we’re going to do something a little different. Regular readers will be aware that our standard approach is to set up a couple of key levels, one serving as support (to the downside) and one serving as resistance (to the upside) and to then use these levels for entry points. Specifically, when we see a close above one of our resistance levels, we get in long towards a predefined upside target, and the converse is true on a close below a support level. Sometimes, however, we get a nice pattern formation, and we like to branch out. The reason we don’t do this more is that on the intraday charts, and especially the low timeframe charts like the five-minute chart we normally use, these patterns aren’t always reliable (at least, that is, not as reliable as they might be on the wider timeframes).
Anyway, this evening, we’re going to it a go.
Take a look at the chart below to get an idea of where things stand this evening, and what we’re looking at as far as entries are concerned.
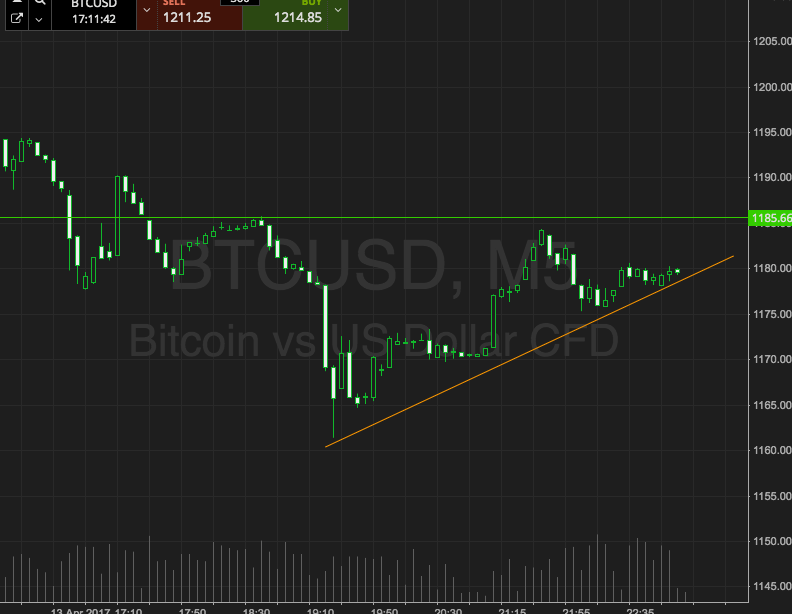

So, as the chart shows, the pattern in question in a triangle. Basically the idea behind these patterns is that price consolidates between the parameters, and builds up a sort of tension. This tension releases on the break of the triangle’s outline, and we enter on the run in anticipation of the break.
So that’s what we’re looking to do. If price breaks through the horizontal resistance around 1185, we’ll be in toward 1200 flat. Conversely, a close below the upwards sloping support level will get us in short towards around $10 worth of target, depending on the break. So, if we see a break at 1180, we’ll be in towards 1170 to the downside.
Charts courtesy of SimpleFX