Wow this week went fast. It’s been a heck of a week from a trading perspective, with the bitcoin price giving us plenty of what we wanted, when we wanted it, and in doing so, allowing us to pull some considerable profits from the market.
So, instead of rambling on this evening, we’re going to get right to the point. Here are the levels in focus, where we are looking to get in and out of the markets according to our intraday bitcoin price trading strategy, and how we are using today’s action to dictate risk. Take a look at the chart below to get an idea of the above. It’s a five-minute chart as usual, and we’ve got our range overlaid in green.
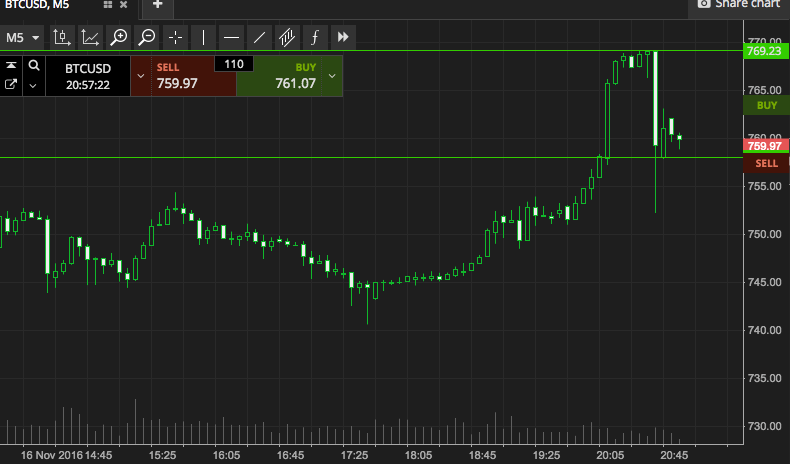

First, the elephant in the room – yes, this is a wide range compared to our standard approach. That’s all we’ll say about that.
We’re going to go at price in two different ways – intrarange (woohoo, it’s back!) and breakout strategy. Our breakouts probably won’t be scalps, given the scope of our range, so keep that in mind as we go forward.
Right.
Intrarange first. This one’s simple – if price reaches resistance (and bounces to the downside, i.e. a failed test), we are going to get in short toward a target of support. A atop just above resistance, somewhere around 779, defines risk.
Conversely, a bounce from support will put us long towards resistance. Similar stop loss placement, but to the downside this time, somewhere around 757.
Looking now at our breakout strategy, if price closes above resistance, we are going to get in long towards 782. A stop at 772 manages risk. If we see a close below support, we’ll get in towards 753, with a stop at 764 to kill of risk in the event that price reverses and trades against our bias.
Happy trading!
Charts courtesy of SimpleFX