In this morning’s bitcoin price watch piece, we highlighted a very tight range in an attempt to draw a profit from our breakout strategy on tight volatility. We had in term resistance at 418 flat, and shortly after publication bitcoin broke to the upside through this resistance, and put us long towards an upside target of 421 flat. Shortly after the break, we broke back within range, but managed to avoid a stop loss hit and again broke to the upside. Since this, however, we’ve been trading pretty much flat along broken resistance. Exactly how this trade will turn out remains to be seen, but it means we can’t get into the market (according to our intraday strategy rules) until it resolves. There will be plenty reading that aren’t in a trade, however, so here’s our interpretation of the day’s action, and some revised key levels that incorporate the latest volatility for this evening’s trading. As ever get a quick look at the chart to see what we are focusing on. It’s an intraday, 15-minute chart showing action from early this morning to the current point.
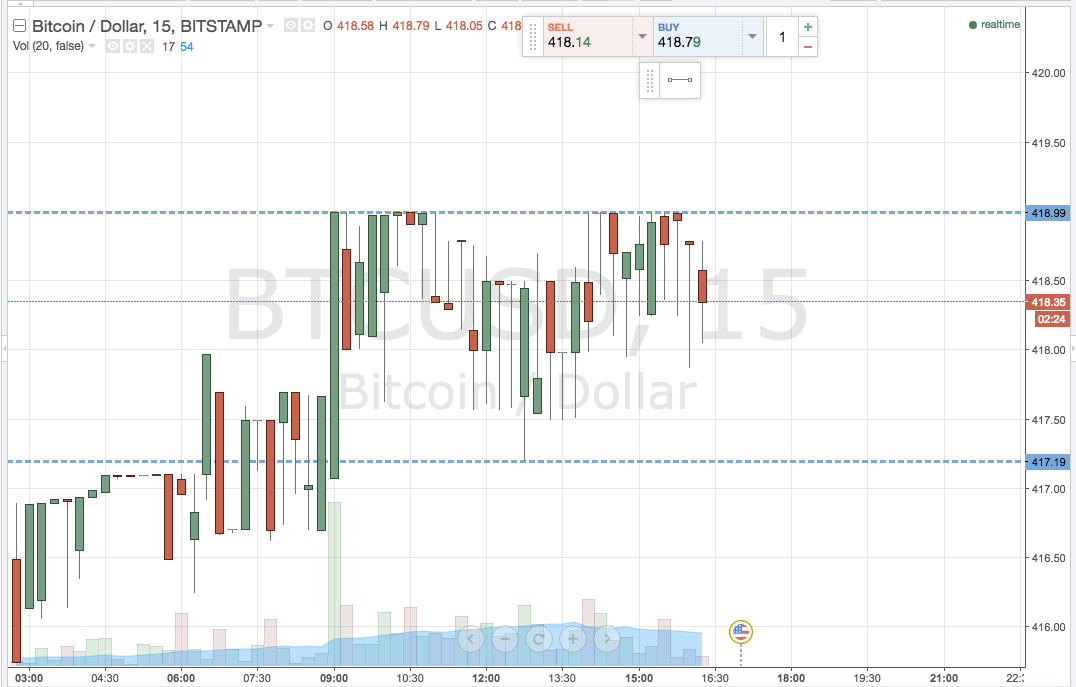

As the chart highlights, the range in focus for this evening’s session, and beyond into the Friday Asian session, is defined by in term support at 417 flat and in term resistance at 419 flat. It’s too tight a range for any intrarange play, so we’ll be focusing purely on our breakout strategy going forward.
Our breakout strategy dictates a long entry on a close above in term resistance, and a stop on this entry somewhere around 418 keeps things tight from a risk perspective. A target of 422 is conservative.
Looking to the downside, a close below in term support will signal a short entry towards 415 flat, with a stop at 418.5 defining our upside risk on the trade.
Happy Trading!
Charts courtesy of Trading View