That’s another week gone in the bitcoin markets, and to be honest, it’s been a pretty dull turnout. We’ve had the odd scalp breakout, and in turn, the odd profit, and we are heading into the close net up on the markets (which can only be a good thing), but it hasn’t been anything to write home about. With any luck, we will get a bit of volume over the weekend (even better, during today’s morning session) and we will be able to get in on some sustained momentum breakouts.
So, with that said, let’s get a look at what happened overnight, and see how that’s going to impact our strategy going forward.
As ever, take a quick look at the chart below to get an idea of our key levels. It’s a five minute candlestick chart and it shows the last twelve hours or so worth of action, perhaps a little less.
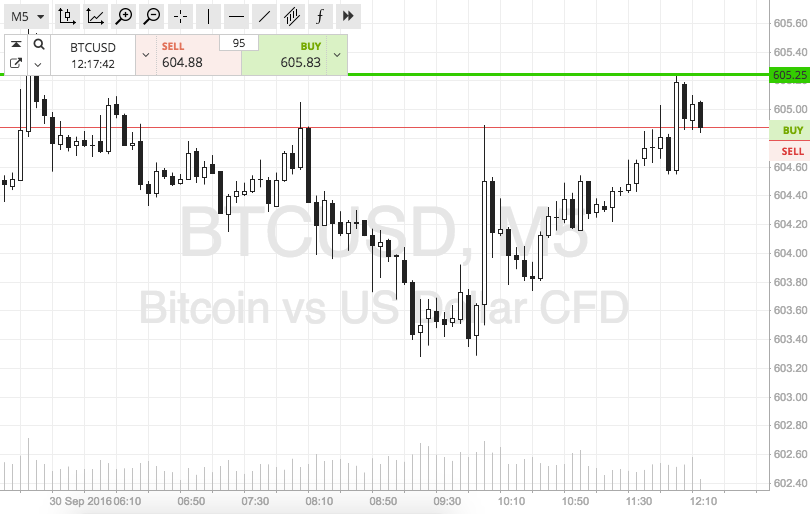

As the chart shows, the range in focus right now is defined by in term support to the downside at 600 flat, and in term resistance to the upside at 605 flat. That’s a five dollar range, so we can just about eek out some intrarange action if we get a bounce from support or a correction from resistance. In these scenarios, target the opposing levels and put a stop loss just the other side of the entry to ensure you are taken out of the trade in the event of a bias reversal.
Looking at our breakout strategy, if price closes above in term resistance we are going to get in long towards an immediate upside target of 610. Conversely, a close below support will signal short towards 595. Stops, once again, just the other side of the entry levels, will keep risk defined.
Happy Trading!
Charts courtesy of SimpleFX