We’re well into the beginning of the week now, and it’s been a pretty interesting one so far. Action yesterday, albeit a little slow, gave us plenty to go at for the morning session, and we managed to get in and out on a short term scalp. Then, overnight, price moved again, and the volatility served up a couple more entry opportunities, both of which we took and got out for a small gain.
So, this puts us next up on the week, and we’ve gotten off to a pretty solid start. The question now, is whether we can maintain this approach, and keep going at price the way we want to.
Let’s take a look.
The chart below is an intraday chart showing the last twelve hours’ worth of action, and it’s got our intraday range overlaid for clarity. Take a look at it before we get going to get an idea of where things stand and where we are looking going forward.
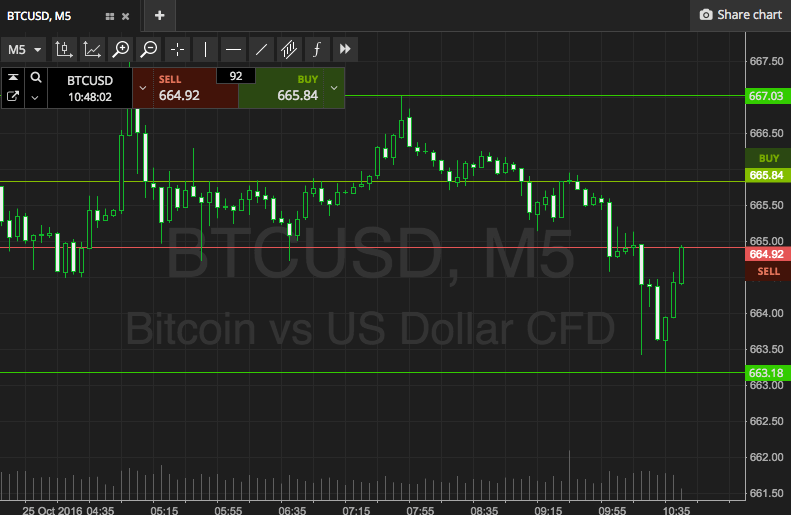

As the chart shows, the range in focus for today’s session is defined by in term support to the downside at 663 and in term resistance to the upside at 667. It’s a reasonably tight range, so we’re going at things with a breakout scalp approach only.
So if we see price break through in term resistance, we will look for a close above that level to validate an immediate upside entry towards 675. A stop loss on the trade somewhere in the region of 665 works to define risk and limit our downside.
Conversely, if we see price close below support, we are going to get in short towards a downside target of 657. Again, a stop loss is necessary, and we’re looking at 665 to keep things tight.
Let’s see what the markets offer up…
Happy Trading!
Charts courtesy of SimpleFX