Ok, we’ve got a fresh days’ trading ahead of us, and it looks as though we might be in for an interesting one. Price has been on the rise gradually overnight in Europe, and we’re closing in on the 800 mark. We have, of course, been in and around this area for a while, and that we are getting a little closer now far from guarantees we are in for a hit. That said, however, this is a return play, meaning we hit this region yesterday and spiked down, yet have returned to trade within the same sort of zone, suggesting the spike was temporary, and there is some strength behind the upside swing.
So, with this in mind, let’s move forward in to the key details and see if we can put a strategy together for the session ahead.
As ever, take a quick look at the chart below before we get started. It’s a five-minute candlestick chart and it’s got our key range overlaid in green.
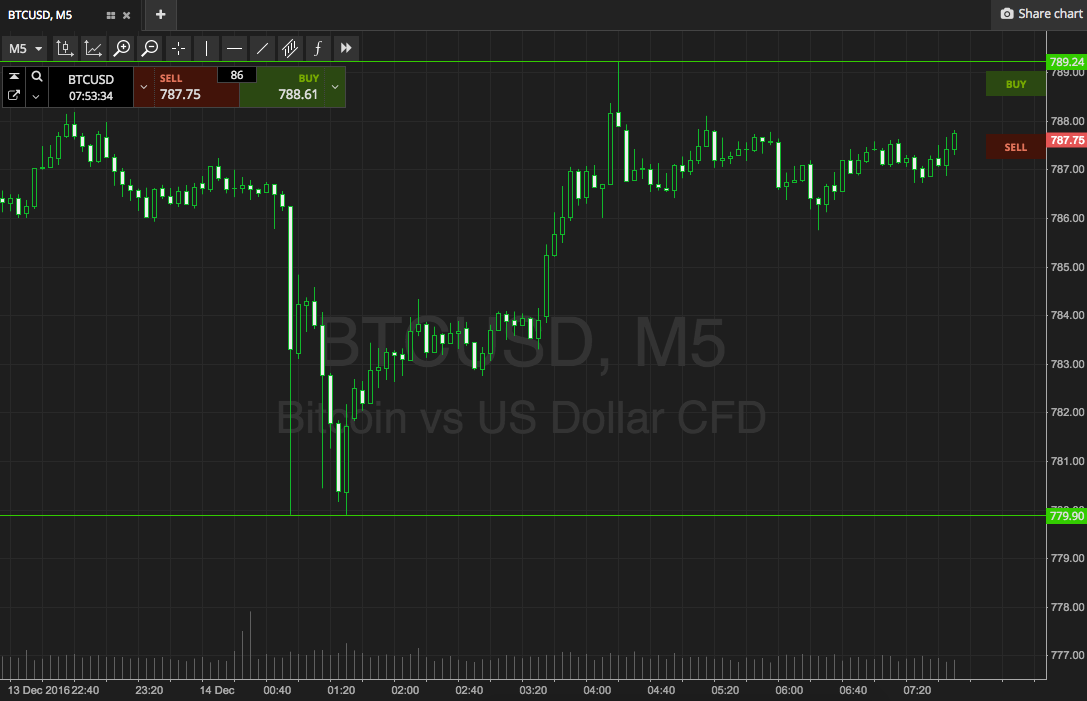

So, as the chart shows, the range we are focusing on right now is defined by in term support to the downside at 779, and in term resistance to the upside at 789. We’re closer to the latter of these two levels as things stand, so we’ll take a look at the upside trade first.
We’re focusing purely on breakout right now, so intrarange is – at least for the morning session – out of the picture. This may change come the afternoon, but for now, breakout stands alone.
So, if we see price break and close above in term resistance at 789, we will look to get in a long position towards an upside target of 797. A stop at 786 defines risk. Conversely, a close below support will put us in short towards 770 flat. On this one, a stop at 782 works well.
Charts courtesy of SimpleFX