And so starts another Tuesday. There’s not been too much action overnight, but we’ve got a few nice key levels to go at today, so with any luck we’ll be able to draw a profit from any volatility that comes to the fore during the European session. As we said a couple of times yesterday, we expect volume to be relatively low over the next couple of weeks. Christmas is generally a low action time in the financial markets, as the major European and North American markets shut down. There’s going to be some Asian action, which should prop up volume, but still, we don’t expect too much.
So, with this in mind, let’s try and put some levels together to head into today’s session with, and see if we can use these levels to going forward.
As ever, take a look at the chart below to get an idea of what’s on, and where we are looking to get in and out of the markets as price moves.
The chart is a five-minute candlestick chart with around the last twelve hours or so worth of action displayed. Our range in focus is overlaid in green.
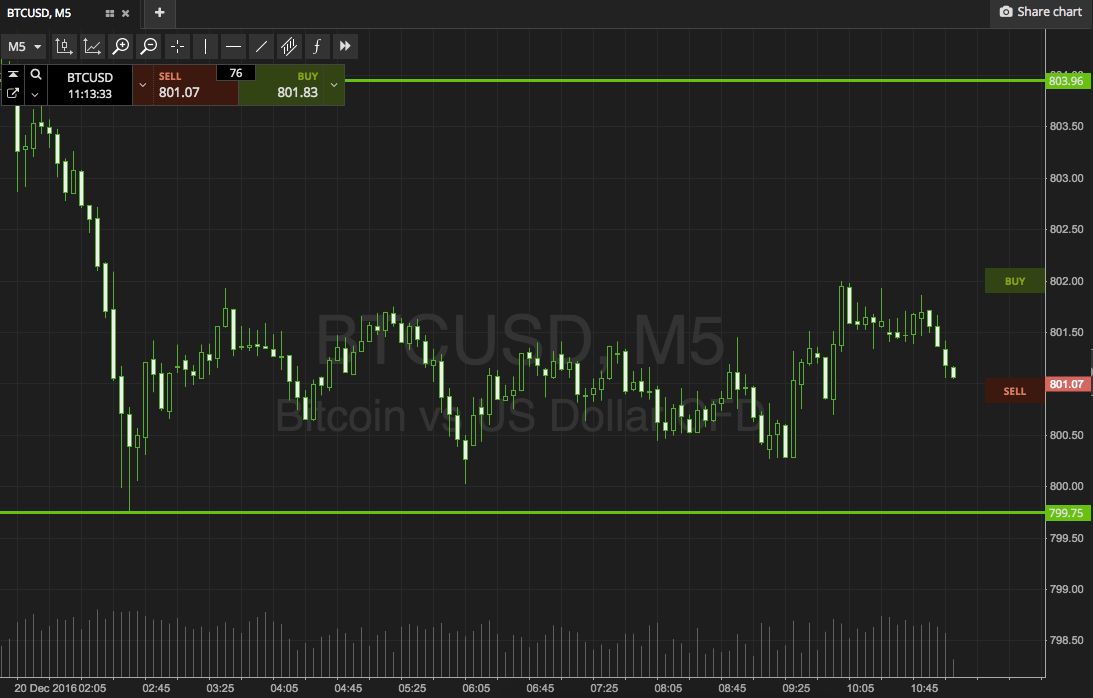

As the chart shows our range for today is defined by in term support to the downside at 799 and in term resistance to the upside at 805.
For our breakout entries, we will look for a close above resistance to give us an excuse to get in long, and we’ll go after an upside target of 810 on the position. A stop on this one at 802 kills off risk on the trade.
Conversely, a close below support will signal short towards 792, and we’ll use a stop loss around 802 to ensure we are taken out of the trade in the event of a bias reversal.
Let’s see how things play out…
Charts courtesy of SimpleFX