When we look back at this week, and compare it to any one or two of the weeks through late October or November, the bitcoin price has moved two or three times as much during the former, than it has the latter two. Why? We don’t know. Does it matter to our intraday strategy? Not really. It’s pretty good news, since the majority of the volatility has come to the upside, and the bitcoin price has inflated considerably across the period.
We pretty much hit four digits yesterday, and have since corrected a bit, but compared to where we’ve been most of the year, it looks as though we’re setting up to finish the year at a far far stronger value than that at which we started. In a year that has been jam packed with geopolitical and economic tension (China, Trump, Russia, Biotech, Oil and Natural Gas – we’re looking at you lot here), such value appreciation in an asset like bitcoin says a lot to me.
That’s a story for another day, however. Right now we’re here to put some levels together to go at in the bitcoin price today, and see if we can close out the week on an intrarange basis with a nice profit.
As ever, take a quick look at the chart below to get an idea of what we’re looking at. The chart’s a five-minute candlestick and it’s got our range overlaid in green.
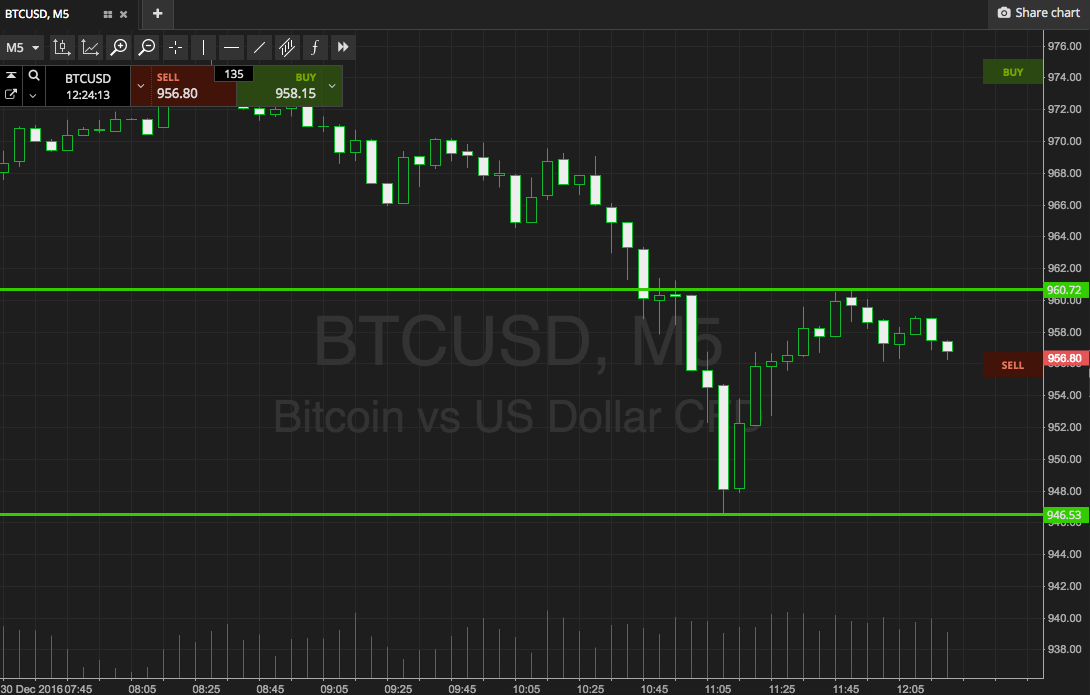

As the chart shows, the range in focus is defined by in term support to the downside at 946, and in term resistance at 960. A little wider than normal, so intrarange, once again, is on.
Breakout, a close above resistance signals long towards 970. Conversely, a close below support will put us in short towards 937. Stops just the other side of the entry to keep risk tight.
Charts courtesy of SimpleFX