So the price collapse we have seen in the bitcoin price over the last four or five days looks as though it is set to continue as we head into the start of a fresh week. Having reached highs of circa at the start of the year, bitcoin now doesn’t seem to be able to find any sort of solid footing, and every interim support level it reaches just crumbles. How long this is set to continue, remains to be seen.
As we mentioned a few days ago, there are a couple of different schools of thought on this one.
The first, that the run started initially as a solid, fundamentally driven run, but was then artificially inflated as mainstream media latched on to the gains, and the late comers piled in to the market in an attempt to draw a profit from the move. Those familiar with traditional asset theory, specifically early 20th Century Dow theory, will know this concept as so called dumb money.
The second, that the run was fundamentally sound to point close to, or at, the peak, and is simply correcting as traders are taking profits off the table, ahead of a reentry.
If it’s the second, we should see a near term recovery. The deeper this correction gets, however, and it’s already looking far too deep to just be called a correction, the more and more likely it is that the second of these two.
Anyway, whatever’s going on, let’s put together some key levels for today. Take a quick look at the chart below.
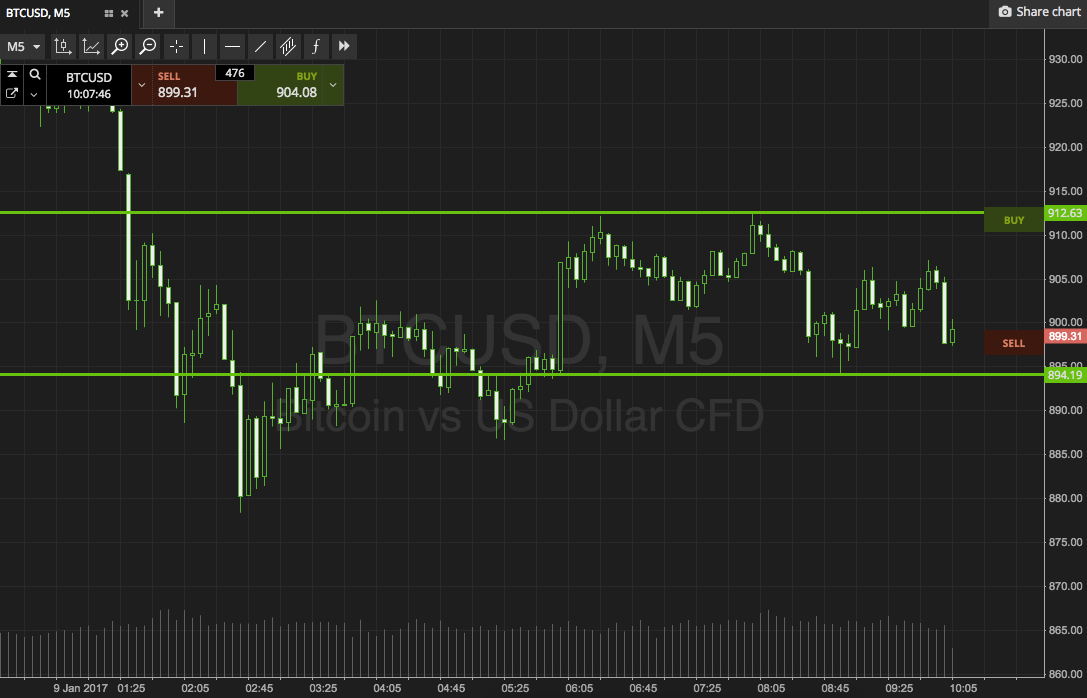

As the chart shows, the range in focus for today’s session is defined by support to the downside at 894, and resistance to the upside at 912. If we see price break above resistance, we’re going to look at a long entry towards 925. A close below support will signal short towards 880.
Stop losses just the other side of the entry on both counts will ensure we are taken out of the trade in the event of a bias reversal.
Charts courtesy of SimpleFX