It’s a fresh week in the bitcoin price, and a fresh opportunity to try and profit from any volatility in the market. Anyone who read our coverage towards the end of last week will know that we were watching the 1100 level as a sort of inflection point. Specifically, of price was unable to break through it, we would likely see bitcoin remain within the 100-1050 range for a period of time while things consolidated. If price did break it, however, it would signal what we would interpret as some near term upside strength, based on the idea that the bulls were pulling back control.
As things turned out, the latter of these two scenarios is what we saw.
The bitcoin price broke through 1100 as part of a pretty clean upside run over the weekend, and has since managed to stay and hold above this level, validating our bullish thesis. We’re now in a sort of sideways trading type zone, and we are seeing a bit of consolidation on the back of the break (this is to be expected) but we are looking long term to the upside as things materialize fundamentally.
So, with this noted, let’s get some key levels outlined for the day’s session, and see what we can do about getting in and out of the markets according to the rules of our intraday strategy today. Take a quick look at the chart below before we get going – it’s got our key levels overlaid in green and it’s a five-minute candlestick chart.
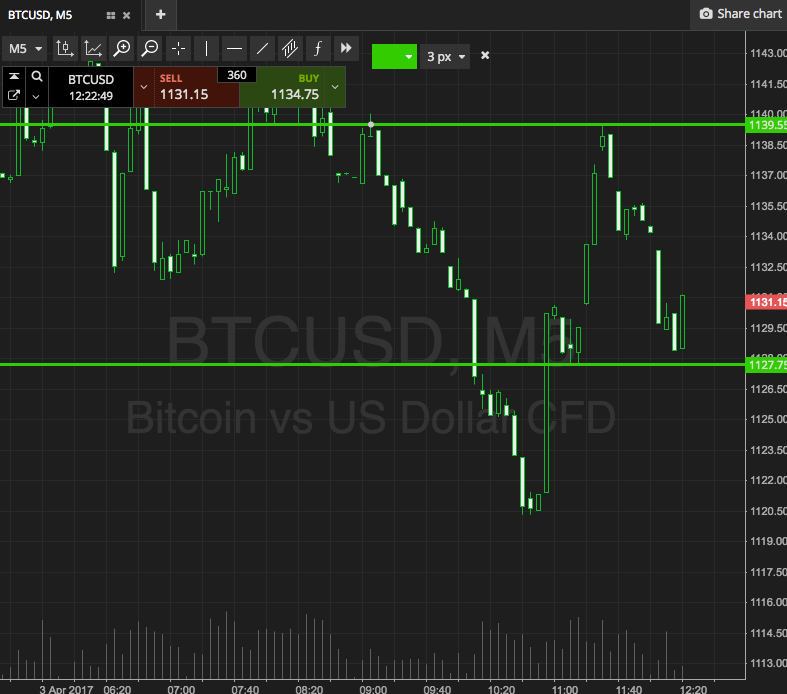

As the chart shows, the range in focus for the session today is defined by support to the downside at 1127 and resistance to the upside at 1139.
If we see price break through the latter, we’re going to look at getting in long towards an immediate upside target of 1150. A close below support will put us in short towards 1115.
Charts courtesy of SimpleFX