We’re already into the second day of the week for our bitcoin price trading efforts, and things have played out pretty much according to our expectations. The break of the 1200 level a few days ago set that level up as longer term support, and we expected to see a retest, which we have done. The level held firm on the retest, and it’s now all about watching the intraday action to see how things play out in line with an upside bias.
We’re not going to waste too much time describing overnight action ahead of the session today, as the bitcoin price is currently trading at or around a potential entry level. If we dwell on what’s happened so far, we’re going to risk missing on the position.
So, let’s get to it.
As ever, take a quick look at the chart below, and we’ll get some key levels outlined with which we can navigate the session ahead. It’s a five-minute candlestick chart, and it’s got our key range overlaid in green.
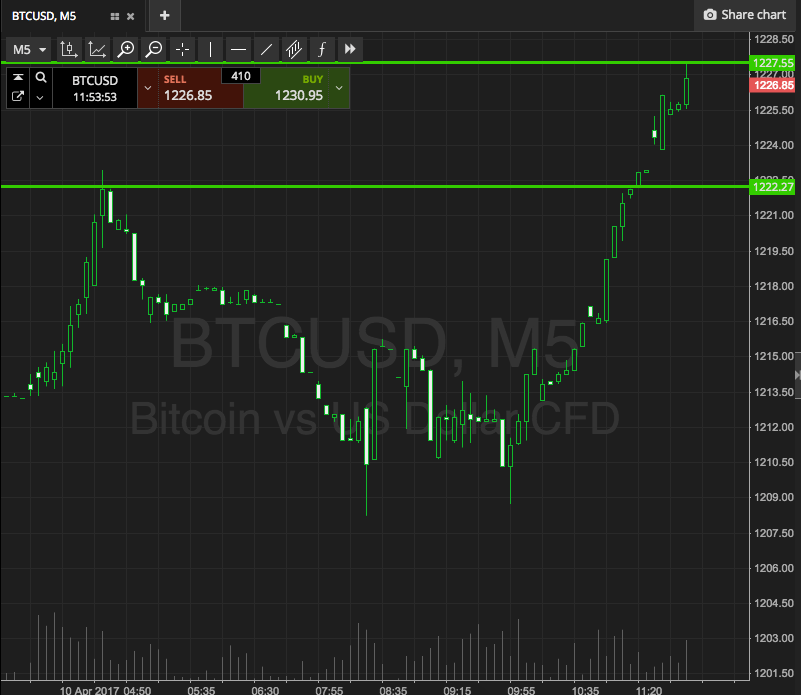

As the chart shows, the range that we’ve got outlined for the session this morning is defined by support to the downside at 1207, and resistance to the upside at 1215. It’s a pretty tight range (something that’s becoming common with our trading efforts of late) and that means we’ve got to keep our targets and stop losses (read: reward and risk) just as tight.
With this in mind, then, we’re going to look for a close above resistance to get us in to a long position towards an immediate upside target of 1225. A stop on the trade at 1212 looks good. On the south side of the trade, we’re going to look at getting in short on a close below support towards a downside target of 1200 flat. On this one, a stop at 1210 will get us out of the position in the event of a bias reversal.
Charts courtesy of SimpleFX