Here we go then. A fresh day’s trading in the bitcoin price and a fresh range to go at with out intraday strategy. Overnight action was pretty good to us. Regular readers will know we’ve been trying to concentrate on a few key levels as indicative of our long term bias and – by proxy – suggestive of how we should approach our shorter term trades from a risk management perspective. We’ve seen a number of these levels break, and we’ve managed to get in and out of the markets according to the rules of our strategy (both breakout and intrarange, but mainly the former) on a number of occasions. Some of these entries have been a little shorter than we might have liked on the reward side of the equation, but not to worry – at least we’re generating a profit.
So, the plan is more of the same. For this morning’s session out of Europe, we’re going to put a few key levels together as definitive of our range, and see where it takes us. Before we get going, then, take a quick look at the chart below to get an idea of what happened overnight, and where things stand right now.
As ever, it’s a five-minute candlestick chart and it’s got our key range overlaid in green.
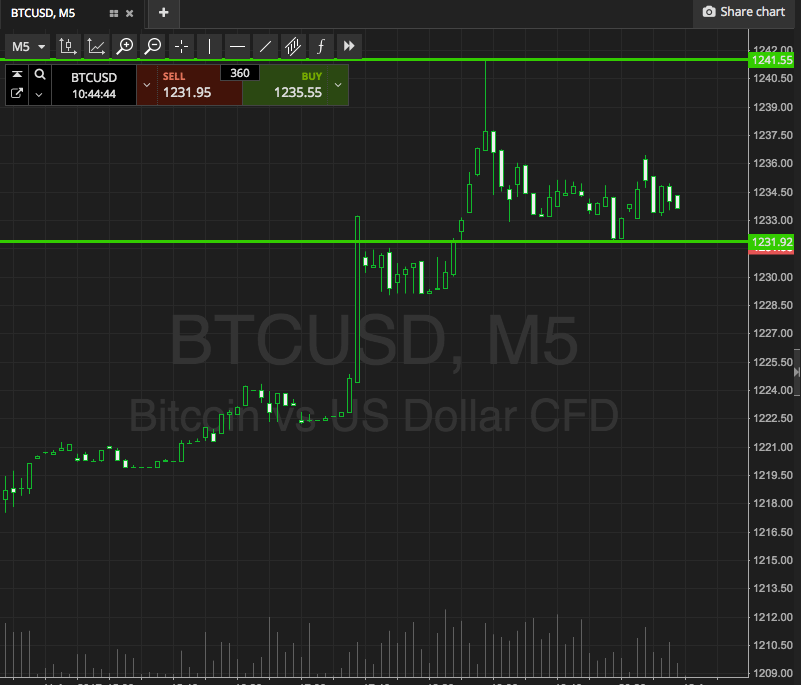

As the chart shows, then, our range for the session this morning is defined by support to the downside at 1231, and resistance to the upside at 1241. If we get a close above resistance on the five-minute chart, we’ll be getting in long towards an immediate upside target of 1252. A stop at 1237 looks good to keep risk tight on the trade.
Looking the other way, if the bitcoin price closes below support, we’ll be in a short position towards 1220. A stop on this one at 1235 works fine.
Charts courtesy of SimpleFX