And we’re off on another weeks’ worth of trading in our bitcoin price efforts, and things are going to be a little unpredictable moving forward. Price corrected pretty severely over the weekend and has spent the last twenty-four hours or so correcting towards previous highs. This is a good thing, of course, but it also means we’re heading towards a double top type position, and further, that once we get there, price will have to break the top, or correct to form a triple top. That makes things tough from a prediction perspective and makes our trading for today a little riskier than normal.
Not that we can’t stay on top of it – we’ll be in with our stops as tight as ever (maybe a little tighter) to ensure that if price does reverse against us, we get out in time.
So, with all this noted, let’s take a look at the levels we’re going for during the session today in an attempt to carve out some sort of strategy for implementation near term.
As ever, take a quick look at the chart below to get an idea of where things stand. It’s a five-minute candlestick chart and it’s got our range overlaid in green.
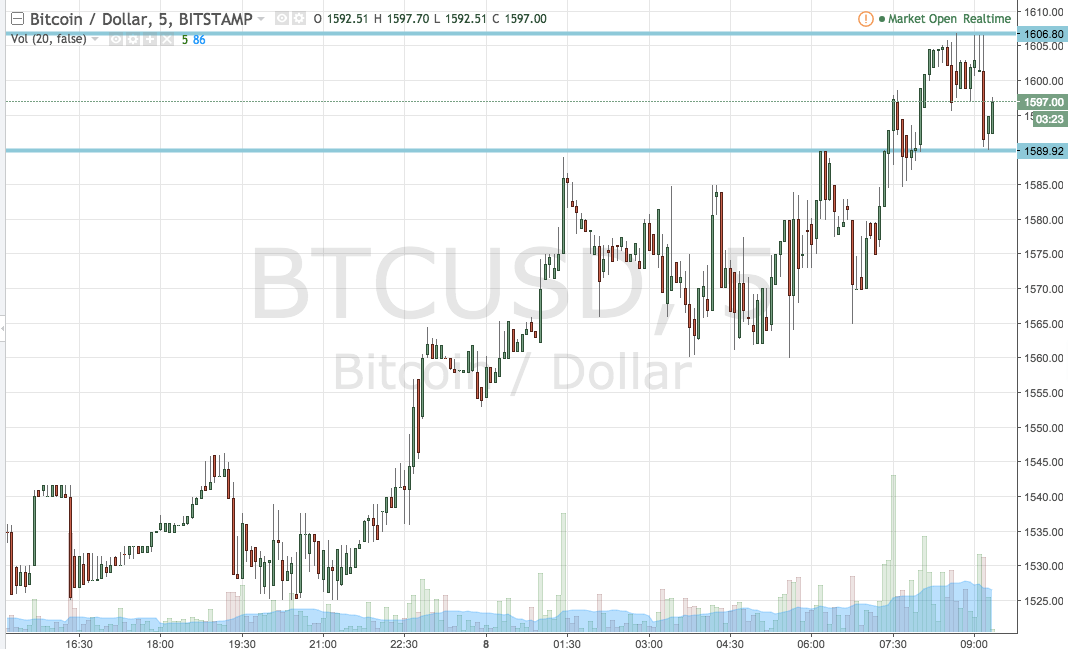

As the chart shows, then, the range we are going for the session this morning comes in as defined by support to the downside at 1589 and resistance to the upside at 1606. Standard breakout rules apply for today, but as mentioned with a particular focus on risk. So, if we see price break through resistance, we’ll be in long on a close above that level towards an immediate upside target of 1620. A stop at 1600 looks good. Conversely, a close below support will have us in towards 1570 and we’ll cap our risk at 1595.
Let’s see what happens.
Charts courtesy of TradingView