Nobody likes a flash crash, but when they come, we just have to hope that they reverse as sharply as possible and that the implications of the crash are short-lived. We saw one earlier this morning out of Europe, with the price dropping from in and around the $2600 mark to just ahead of $2520 in a matter of minutes.
Since the dip, we have seen something of a recovery, and the bitcoin price trades around $2570 as things stand. While it is not an ideal start to the day, it does give us a pretty solid set of key levels with which we can carry forward into the session, and – by proxy – should give us some relatively straightforward entry signals as price action matures.
So, with this noted, and as we move into the session this evening, here is a look at what we are focusing on in the bitcoin price and where we intend to get in and out of the markets according to the rules of our intraday strategy (and against a backdrop of the sharp decline we saw this morning).
As ever, take a quick look at the chart below before we get started to get an idea of what is on. It is a one-minute candlestick chart and it has our key range overlaid in green.
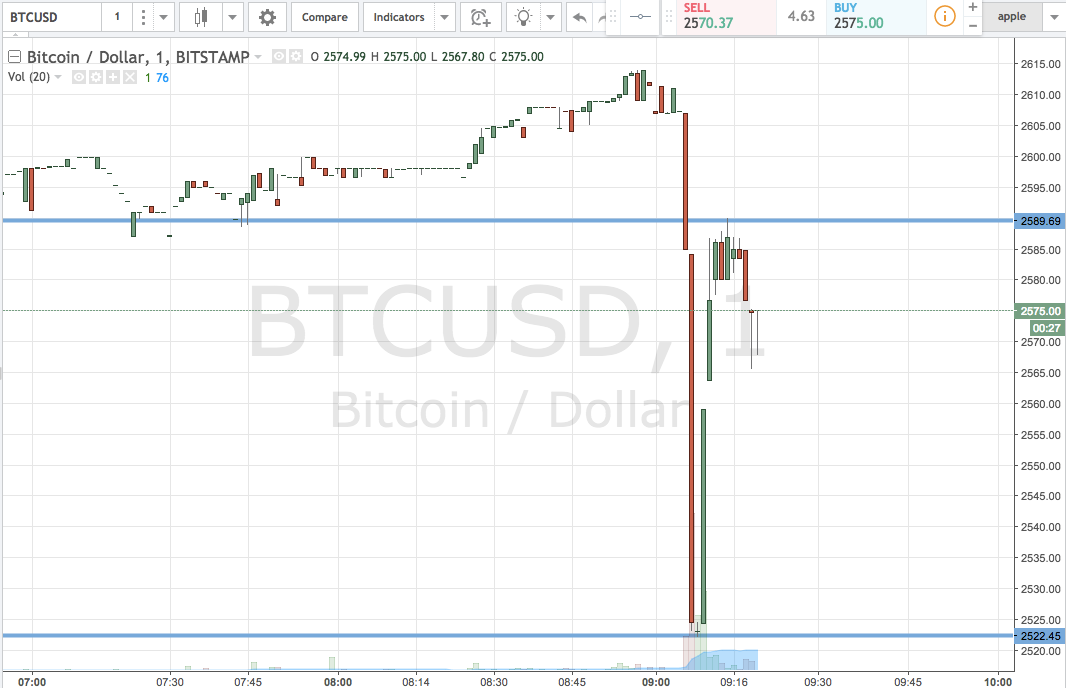

So, as the chart shows, the range we are focusing on for the session today is defined by support to the downside at $2522 and resistance to the upside at $2589. We will initially look for a close above resistance (as this is the level we are trading closer to right now) to validate an immediate upside target of $2610. A stop loss on the position at $2580 works to define risk.
Conversely, a close below support will have us in towards $2500 flat. A stop loss on this one at $2530 works well.
Charts courtesy of Trading View