The bitcoin price is on the move already this morning so we aren’t going to waste any time getting started. Overnight action gave us plenty to discuss, but we will come back to it later on when we put forward the second of our twice daily Price watch pieces. For now, because things are moving so fast, we are going to jump straight into the market and get our key levels outlined and put in place so that our readers can do the same.
So, with that said take a look at the chart below before we get started so as to get an idea and a picture of what happened last night. It is a one-minute candlestick chart and it has our range overlaid in red.
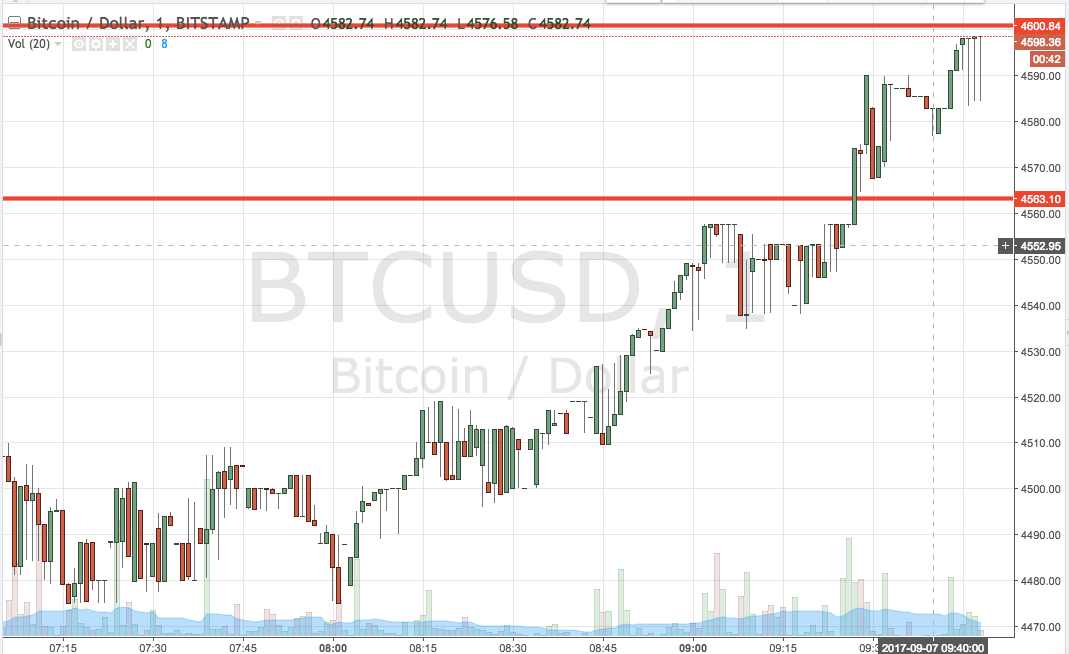

As the chart shows, action overnight was generally bullish and brought us to trade just shy of the 4600 mark – a level that we have been watching for some time now as indicative of long-term strength.
Our support and resistance levels for the session today come in as defined by support to the downside at 4563 and resistance to the upside 4600 flat. Because things are moving so fast, we are going to stick with our standard breakout approach for the time being. If we see price settle down between now and the end of the session, we will consider bringing intrarange into play, but not yet.
So, if we see price close above resistance, we will enter long towards an upside target of 4640. A stop loss on the position at 4590 will ensure we are taken out of the trade in the event of a bias reversal. Looking the other way, if we see price close below support, it will signal a short trade towards 4520. A stop loss on this one at 4570 works well.
Charts courtesy of Trading View