So we’re off on a fresh week of trading in the bitcoin space and it looks as though it’s going to be a pretty interesting one. Price over the weekend gave us plenty of volatility and the question everyone is asking right now is whether the volatility is going to continue or whether we’re going to get some degree of reprieve.
The answer, of course, is that we just don’t know. With any luck, we’ll see a brief period of consolidation followed by a breakout (to the upside, hopefully) and a sustained period of appreciation. We’d love to see 4000 come back into play as well.
If that’s not how things turn out, however, it’s not too much of a problem. So long as we are able to jump in and out of the markets if and when things move, all is well.
So, with that in mind, let’s get some levels in place for the session. As ever, take a quick look at the chart below before we get started so as to get an idea of where things stand and how action over the weekend brought us to trade where we are today. The chart is a one-minute candlestick chart and it’s got our key range overlaid in red.
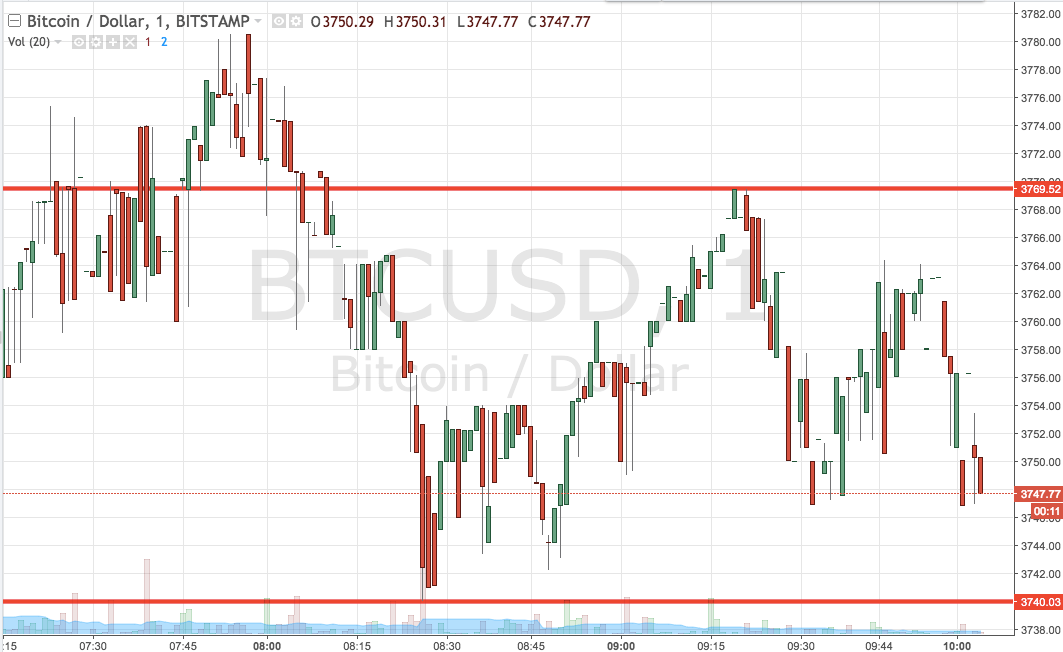

As the chart shows, then, the range we are going to take into the session today comes in as defined by support to the downside at 3740 and resistance to the upside at 3769. We’re going to go at price with a standard breakout approach for the intraday session, so we’ll look at jumping into a long trade on a close above resistance towards a target of 3800 and, conversely, into a short trade if we see a close below support towards a downside target of 3700.
Let’s see how things play out.
Charts courtesy of Trading View