We are off on a fresh week of trading in the bitcoin price and things are looking extremely positive during the early European session. Over the weekend, price returned to the $4500 level that we last saw at the beginning of September (or, more accurately, this time last month) and it looks as though the impact of the Chinese regulatory efforts has been completely negated and priced out of the market within four weeks – a real win from an adoption perspective.
With this noted, then, let’s get some levels in place that we can use to try and draw a profit from the market if we see a continuation of the volatility that dominated price over the weekend, today. As ever, take a quick look at the chart below before we get started. It is a one-minute candlestick chart and it has our key range overlaid in green.
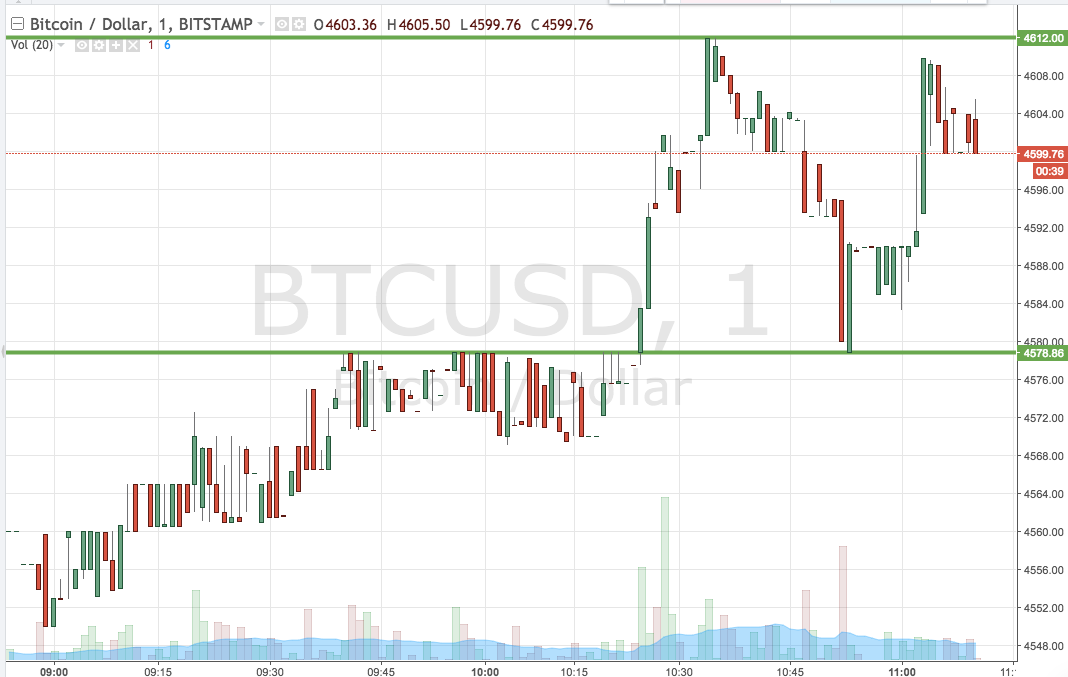

As the chart shows, then, range we are looking at for the session today comes in as defined by support to the downside at 4578 and resistance to the upside out 4612. We are going to go at the market with both an intrarange and a breakout approach today, so as an initial strategy, we will look at entering long on a bounce from support towards an immediate upside target of resistance and, conversely, short on a correction from resistance towards support.
Looking at our breakout approach, if we see price close above resistance, we will jump into a long trade with an immediate upside target of 4650. A stop loss on the position at 4600 works to keep risk defined. Looking the other way, a close below support will have us in short towards an immediate downside target of 4540. Again we need a stop loss on this one and somewhere in the region of 4586 looks good.
Charts courtesy of Trading View