We have reached the final day of the week in our bitcoin price trading efforts and what a final few days it has been. The bitcoin price broke through the $5,000 mark late on Wednesday evening, early Thursday morning depending on where you are and, subsequent to the break, hasn’t really looked back. We are now sitting at a point where price has run more than $1,000 in less than 24 hours and this is where things get a little bit hairy.
There is every chance that we may see a near-term correction and, if we do, the extent to which price gives back value to markets is tough to call.
As long as we don’t get any severe fundamental shocks (like we did out of China last time) then things should stay relatively subdued.
Anyway, whatever happens, we are going to make sure we will be ready.
Let’s get some levels outlined that we can use to take advantage of any action in the bitcoin price during the session today. As ever, take a quick look at the chart below before we get started so as to get an idea where things stand and where we are looking to jump in and out of the markets according to the rules of our strategy moving forward. It is a one-minute candlestick chart it has our range overlaid green.
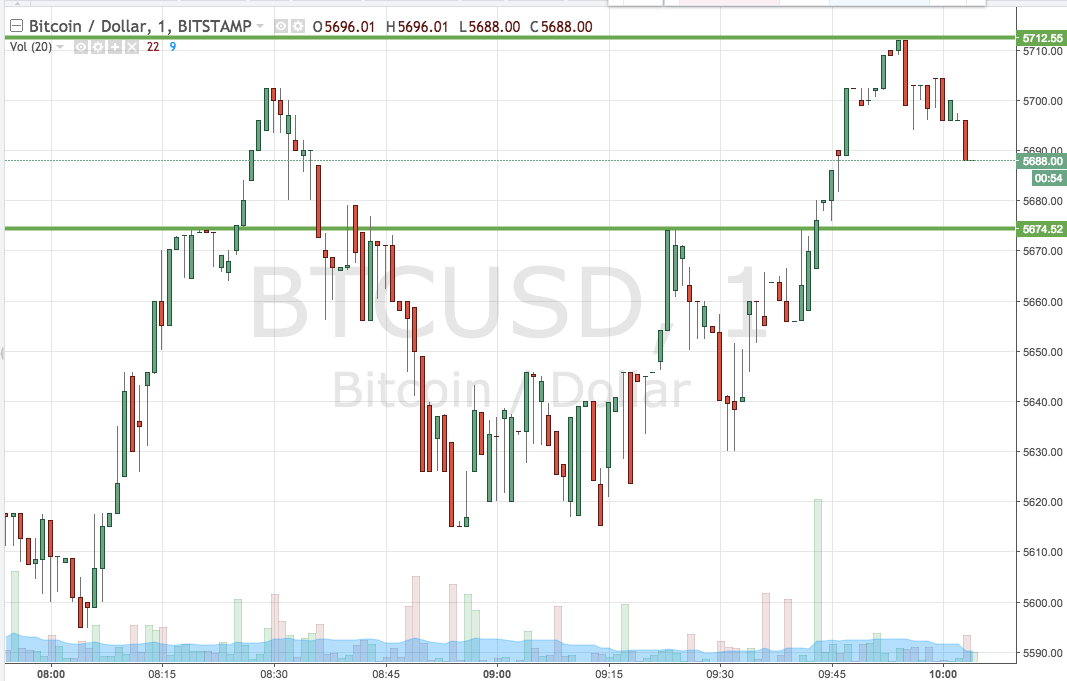

As the chart shows, the range we are using for the session today comes in as defined by support to the downside at 5674 and resistance to the upside 5712. If we see a close above resistance, we will enter long towards an upside target of 5750. A stop loss on the trade at 5700 looks good. Looking the other way, if we get a close below support, we will enter short towards 5620. A stop loss on this one at 5685 works well.
Charts courtesy of Trading View