Things have been pretty volatile overnight in the bitcoin price and we are heading into the session today (Tuesday, European morning) with a degree of uncertainty as to how things are going to play out moving forward. It’s not that we have seen any large-scale price moves or anything like that, but there seems to be a battle going on between the bulls and bears and this sort of consolidation activity inevitably results in continued volatility until it matures to completion.
The hope is that, on resolution, we will see a breakout to the upside and, in turn, price run towards the $6000 mark. There is every chance that the opposite could occur, however, so we have got to keep that in mind so as to avoid jumping into anything stupid.
So, with that said, let’s get some levels put in place that we can use to try and draw a profit from the market as and when things move. As ever, take a quick look at the chart below before we get started so as to get an idea where things stand. It is a one-minute candlestick chart and it has our range overlaid in green.
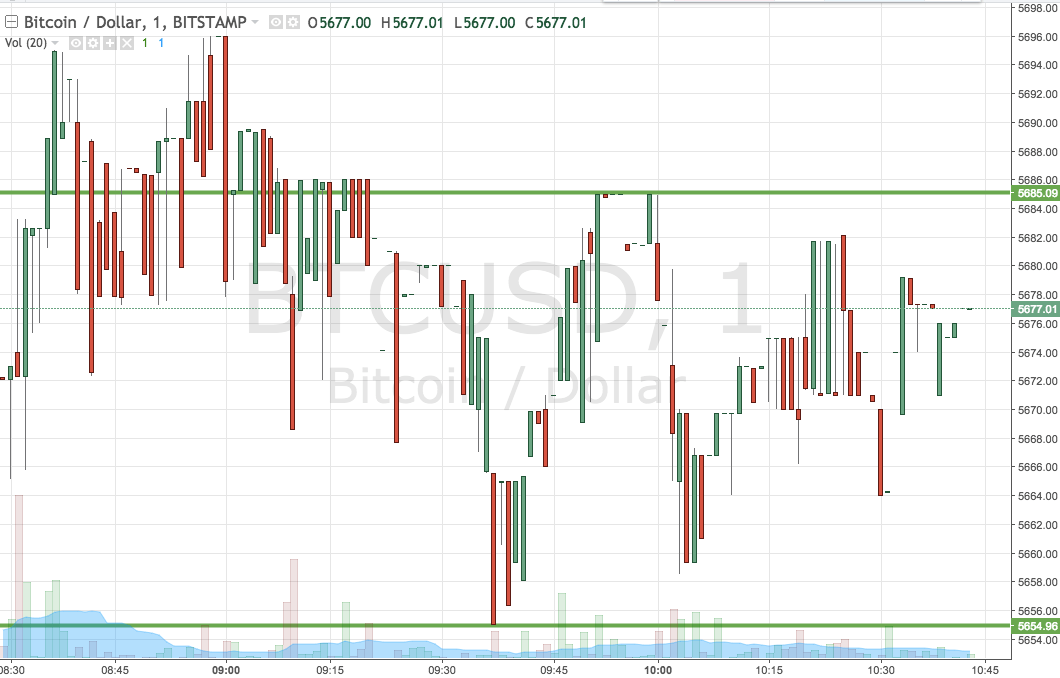

As the chart shows, the range we are going to use for the session this morning comes in as defined by support to the downside at 5654 and resistance to the upside at 5685. Standard breakout rules apply for now (action is too choppy for us to bring intrarange to the table), so we will look at entering long towards an immediate upside target of 5725 if price breaks above resistance. On this one, a stop loss at 5670 looks good.
Looking the other way, if price closes below support, we will enter short towards a downside target of 5630. A stop loss on this one at 5665 should help us keep things tight on the risk side of the equation.
Charts courtesy of Trading View