So here we go on another day of trading in the bitcoin space and we’ve got plenty to discuss heading into the early European session. While we didn’t get the dramatic run that we saw at the close of the week a couple of weeks back, we did see some upside action on Friday and, over the weekend, the action was supported pretty strongly.
We are looking for this support to remain in place during the session today, with expectations (on a longer-term basis) being that if price can manage to hold above the $18,000 region, we’ll see $20,000 broke before we see $17,000 again.
As mentioned, however, that’s a bit longer term than the immediate scope of our shorter term, intraday operations.
With this noted, then, let’s get some levels in place that we can employ as the basis of our intraday strategy today.
As ever, take a quick look at the chart below before we get started so as to get an idea where things stand. The chart is a one-minute candlestick chart and it’s got our primary range overlaid in green.
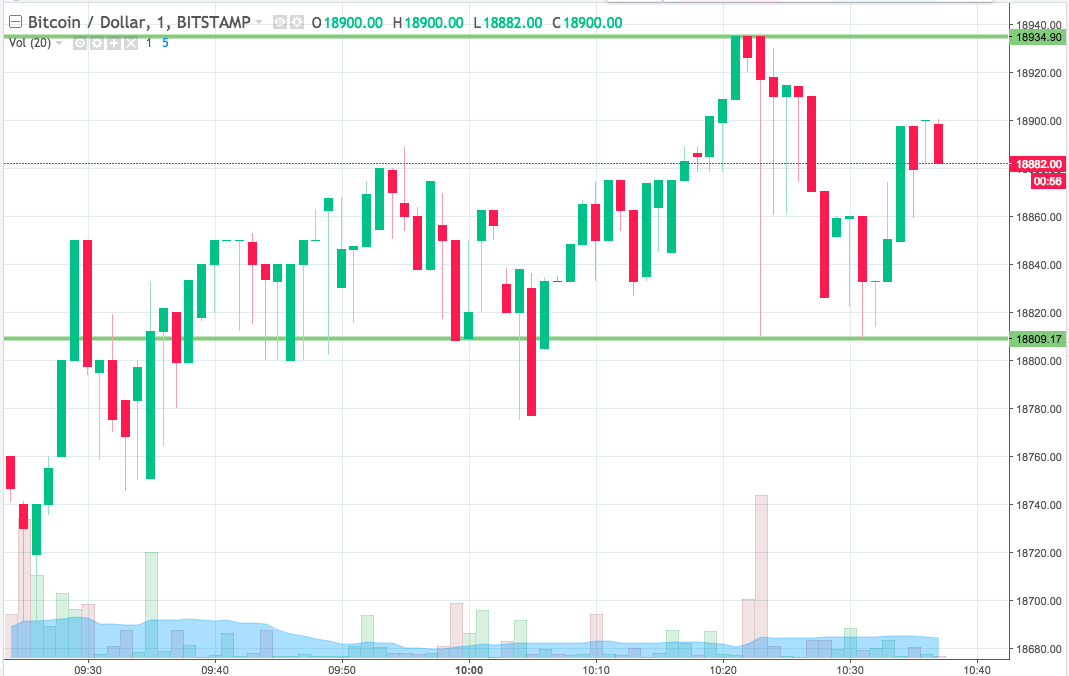

As the chart shows, the range we are looking at for the session today comes in as defined by support to the downside at 18809 and resistance to the upside at 18934.
We are going to stick with our standard breakout strategy for the time being, so our trades are as follows:
Trade one – a long entry on a close above resistance. Target somewhere in the region of 19000 flat and a stop at 18900 to kill off risk.
Trade two – a short entry if we see price close below support. On this one, a target in and around 18750 looks good, while a stop at 18825 will ensure we are taken out of the trade if things turn against us.
Let’s see how things play out.
Charts courtesy of Trading View