It’s Thursday morning and it’s time to take our first look at the action we saw overnight and try to use it to form some sort of strategy for the forward session. We are going to jump right into things so as to avoid missing out on any potential entry points. So, before we get started, take a quick look at the chart below before we get started. It’s a one-minute candlestick chart and it’s got our primary range overlaid in green.
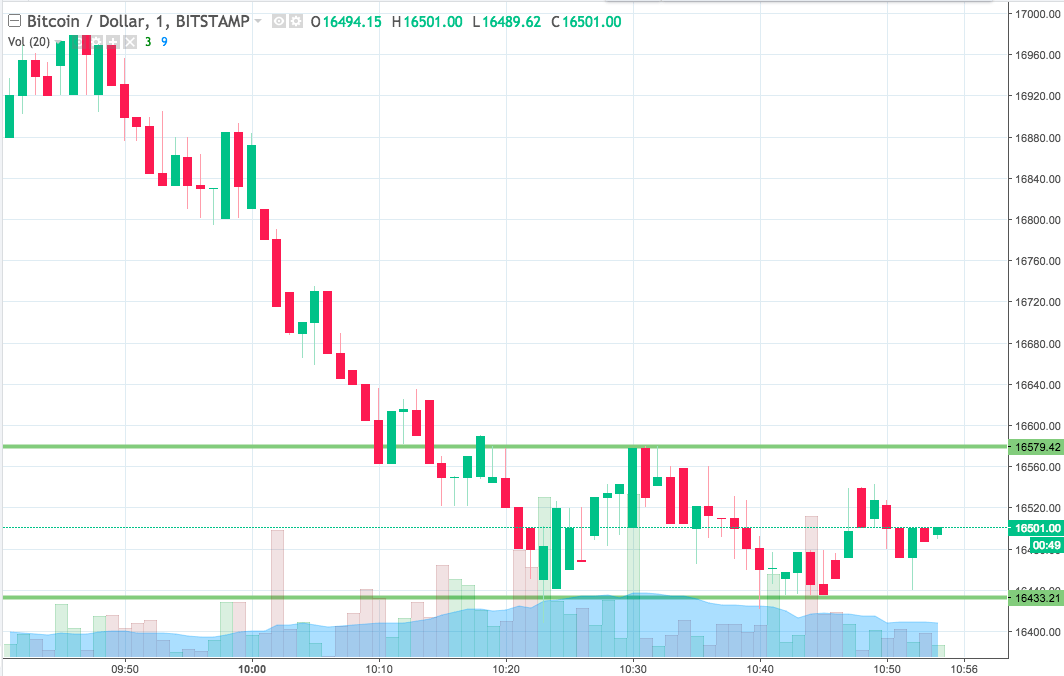

As the chart shows, then, the range we are going for with our approach today comes in as defined by support to the downside at 16433 and resistance to the upside at 16579. We are going to go at things with our breakout strategy for the time being purely because we don’t want to find our selves on the wrong end of a breakout (or even potentially missing out on one) while we are stuck in an intrarange position.
So, our strategy is as follows. We’re going to look out for a close above resistance to signal an upside entry. On this trade, we’ll get in long towards an immediate upside target of 16630. A stop loss on the trade somewhere in the region of 16560 will ensure we get taken out of the trade for nothing more serious than a small loss if and when things turn against us.
Looking the other way, we are going to try and get in short if we see a close below support. The trade will target a downside target of 16360. This one gives us a little more room from a risk management perspective, so we can be a little more flexible with our placement. Somewhere around 16360 looks like it should do the trick.
Let’s see how things play out and we will revisit this evening.
Charts courtesy of Trading View