It’s Tuesday morning, and time to take the first of our two looks at the action in the bitcoin price for today. Before we do, let’s take a quick look at what happened overnight, as this is going to influence how we approach the markets this morning.
Specifically, action last night formed something of a head and shoulders pattern on the five-minute chart. A head and shoulders forms when we get a peak, a dip, a higher peak, which then dips into another peak similar in height to the first, but not as high as the second. It’s a classic reversal pattern, and gives us an immediate downside bias heading into the session this morning.
This doesn’t mean we are going to go exclusively short with our trading, but it does mean we can be a little more aggressive on our short entry than we will be on our long trade.
So, how do we trade the pattern? It’s pretty simple. The pattern completes when price breaks below the neckline, which is the horizontal point at the dip of the first or last peak, whichever is lower.
In this instance, the neckline is at 603 flat. This level is also going to serve as our in term support for the day’s session, although we won’t use it for anything other than a downside break entry. Resistance comes in at 606, and this is far too tight a range to go at price intrarange.
The chart below shows the pattern and the key levels for the session.
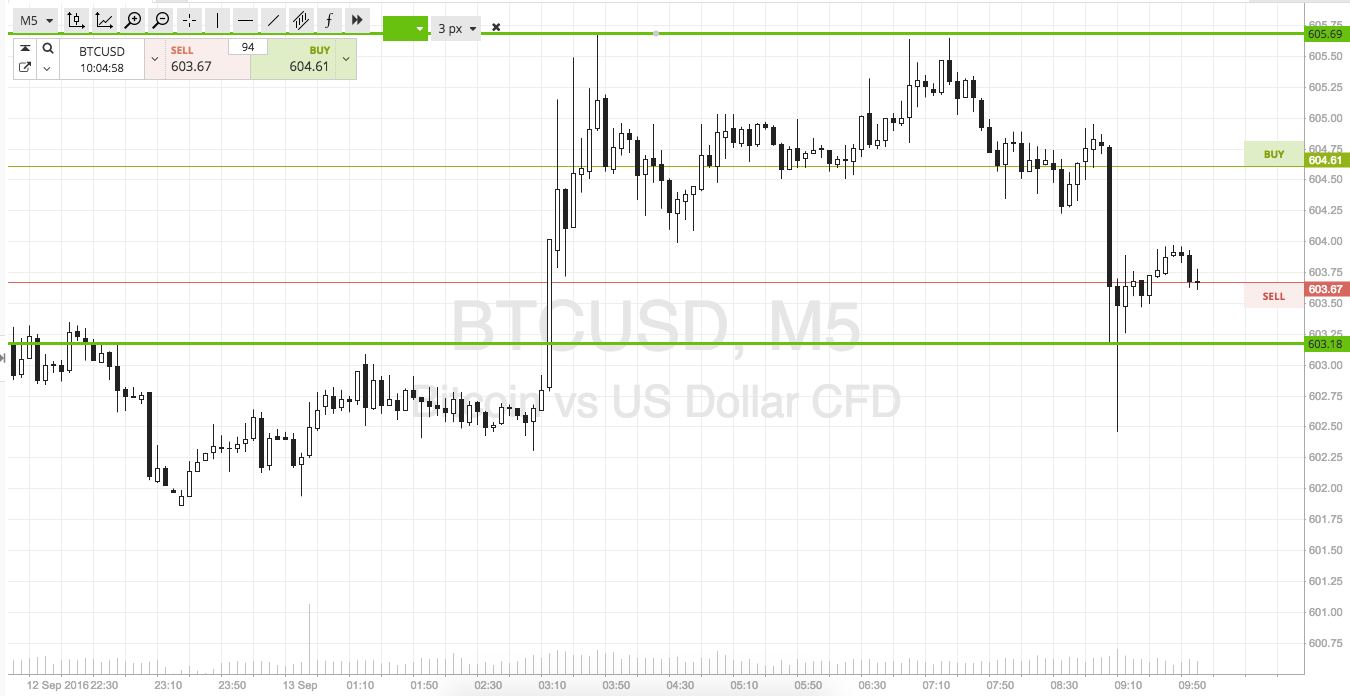

So, a close below the neckline at 603 will signal a short entry towards an immediate downside target of 597. A stop at 604 defines risk nicely on the position.
Conversely, a close above resistance would invalidate the pattern and give us an immediate upside bias. Long on the close towards an upside target of 610 flat. Stop at 603 to keep risk tight.
Charts courtesy of SimpleFX