We are heading into a fresh weeks’ worth of trading in the bitcoin price, and with last week’s action giving us plenty to trade and discuss, we are hoping to get a similarly volatile market this time around. The underlying fundamentals certainly point to some indecision, but exactly what this means for the chances of a sustained directional bias (and in turn, a profitable breakout entry) isn’t totally clear. With indecision will often come some level of consolidation, and this might contribute to a slow start in the space.
So, with all this in mind, what are we looking at for today’s session, where will we look to get in and out of the markets on any volatility, and what did action over the weekend tell us about what we can expect this week? As ever, take a quick look at the chart to get an idea of the morning’s parameters. The chart is a 15 minute, intraday chart that shows the last 48 hours or so worth of action in the bitcoin price.
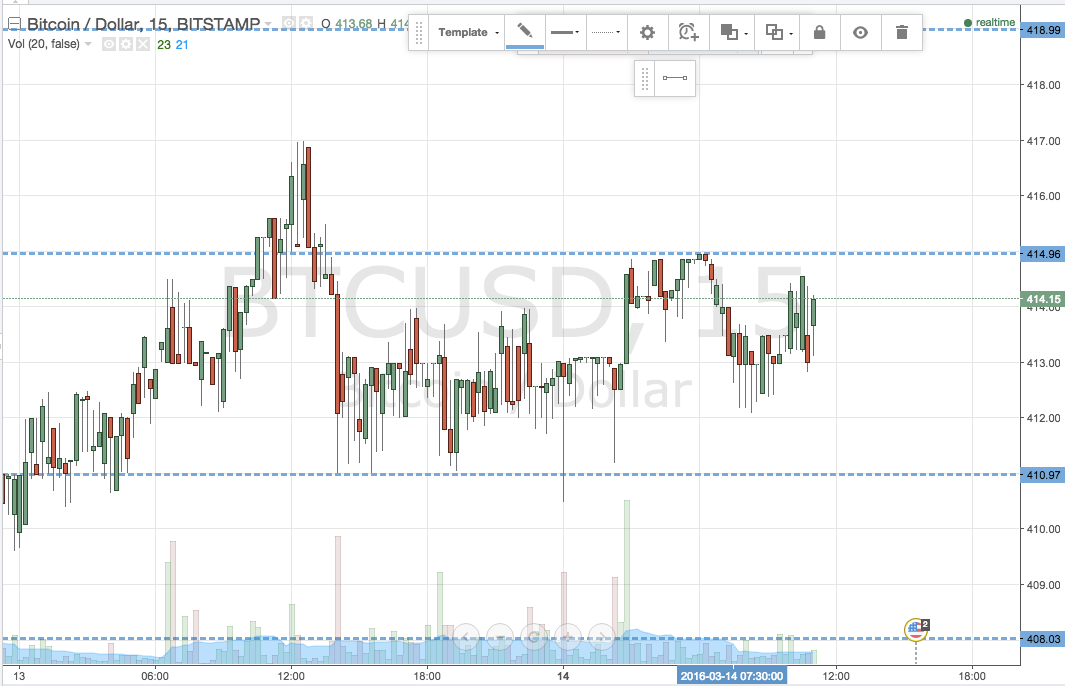

As you can see from the chart, the levels to keep an eye on, and the ones that define today’s range, are in term support at 411 flat, and in term resistance at 415 flat. It’s a wide enough range to bring our intrarange strategy to the table, so as ever, long at a bounce from support towards a target of resistance, stop just below entry. Reverse the trade on a correction form resistance.
Looking at breakout, a close above in germ resistance will signal a long entry towards 419 flat, with a stop at413 protecting our downside. On the short side of things, a close below support will put us in a bearish position towards an initial target of 408. It’s pretty tight, ad an equally tight stop is needed, so somewhere in the region of 412 looks good.
Charts courtesy of Trading View