We are midway through the European session and the bitcoin price has given us plenty to go at so far today. Things were relatively volatile of the weekend, primarily because of the fundamental developments out of China and the ICO ban that the People’s Bank of China announced. Bitcoin took a hit on the back of the news and price gave away around 10% its at-market valuation.
Early morning on Monday, however, things look to be well on the way to recovery and price currently trades in and around $4300 a piece. Exactly what we’re going to see throughout the remainder of the session remains to be seen – we might see some degree of consolidation as volume will likely be muted because of the Labor Day shutdown in the US. Anyway, let’s get some levels outlined with which we can seek to take advantage of price however it moves going forward. As ever, take a quick look at the chart below before we get started. It is a one-minute candlestick chart and it has our range overlaid in red.
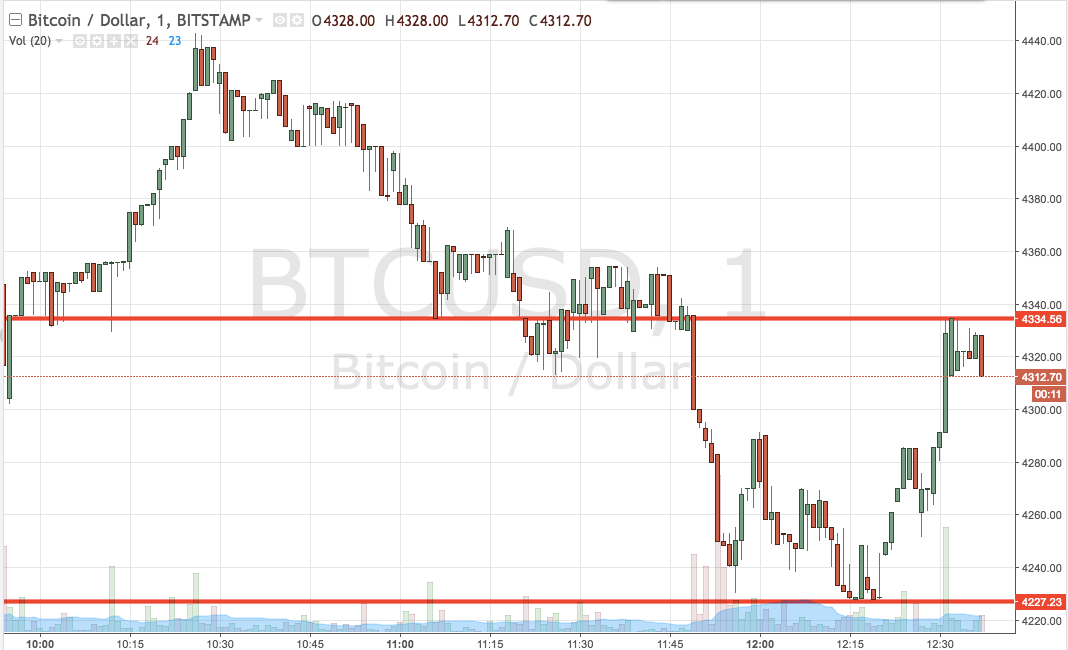

As the chart shows, the range we are using for the session today comes in is defined by support to the downside at 4227 and resistance to the upside at 4334. That’s a pretty wide range, so – for now at least – intrarange is an option. If we see a bounce from support, we will enter long towards resistance. Conversely, a correction from resistance will have us in short towards support.
Looking at our breakout strategy, if we seek price close above resistance, we will enter long towards a target of 4400. A stop loss on the trade at 4320 looks good. Looking the other way, a close below support will have us in short towards 4180. A stop loss on this somewhere in the region of 4240 will ensure we are taken out the trade if things turn against us.
Charts courtesy of Trading View