So, it’s Wednesday morning, and time to get things kicked off with the first of our twice daily bitcoin price watch analysis. Overnight action was relatively flat, and we didn’t manage to get into any positions with the range we had highlighted. However, price did carve out a relatively steady range, meaning today we should see some nice reactive action if we get a breakout. So far this week it’s been pretty easy trading – a couple of scalp breakout entries and some intrarange action, with more take profits than stop losses. Let’s hope things continue to run as smoothly moving forward. So, with that said, let’s take a look at the details. As ever, take a quick look at the chart below to get an idea of how action played out overnight, and where we are placing our range for today’s session. It is a five-minute candlestick chart, showing the last 12 hours’ worth of action, with our range in focus overlaid green. 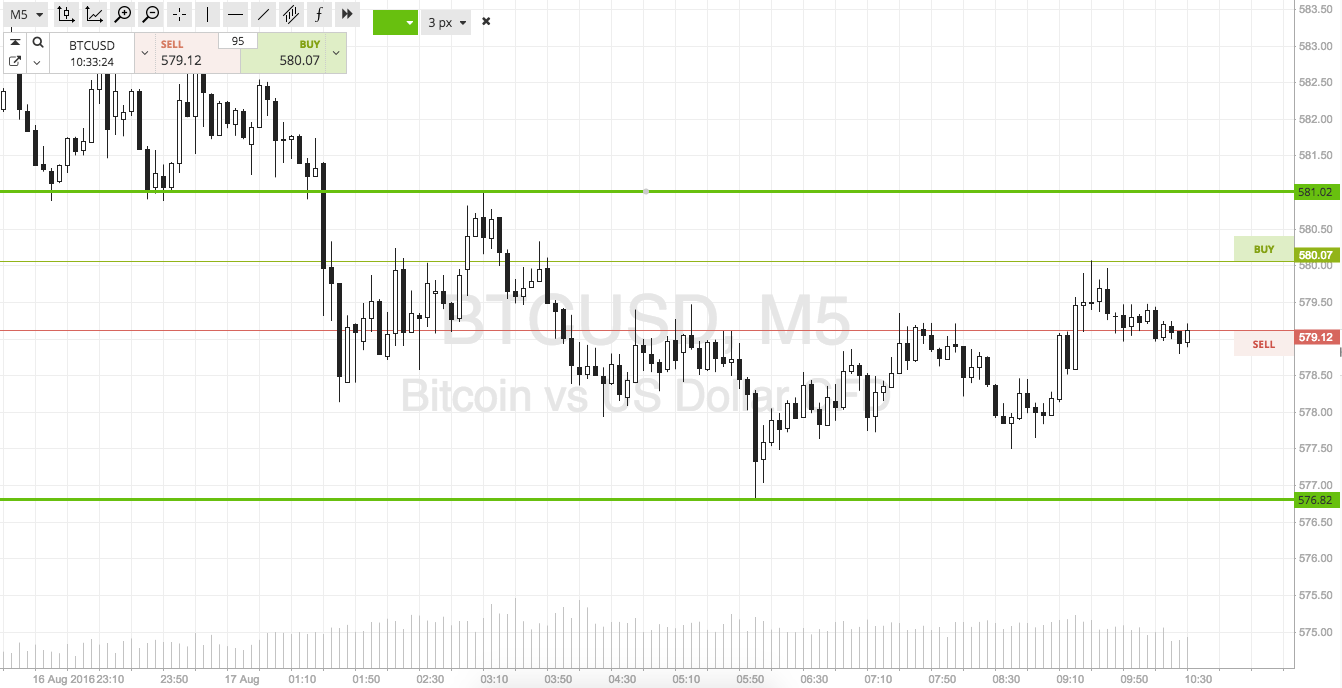

As the chart shows, the range we are focusing on this morning is defined by support to the downside at 576, and to the upside, resistance at 581. There’s not quite enough room to go at things with an intrarange strategy on this one, at least not yet. If action today allows us to widen out our range a little bit, then we can think about incorporating it into our strategy a bit later on. For now, however, we are going to stick with our breakout entries. Specifically, if price breaks above (and closes above) resistance, we will get in long towards an immediate upside target of 590. A stop loss on the position at 579 looks good. Conversely, if price breaks below support to the downside, we will get into a short position and target 565. It’s a pretty aggressive trade, so we’ve got plenty of room for our stop loss, and somewhere around 578.5 works well.
Charts courtesy of SimpleFX