It’s Tuesday morning, and we’ve had a pretty interesting start to the week. Things flattened out toward the end of last week, and as the weekend rolled by it looked like we may just get a continuation of the flat action. By the open of play on Monday, however, things were looking a little more active. The activity carried through the Monday session, and we got chopped out a couple of times on some erroneous entries. Overnight was a little easier on us, and we managed to get in for a decent gain on a breakout scalp position.
So, as we head into a fresh European session today, how are we expecting things to play out? Let’s take a look.
As ever, take a quick look at the chart below to get an idea of what we are focusing on. It’s an intraday, five-minute candlestick chart with the last twelve hours or so worth of action displayed. Our range for the European morning session is displayed in green. 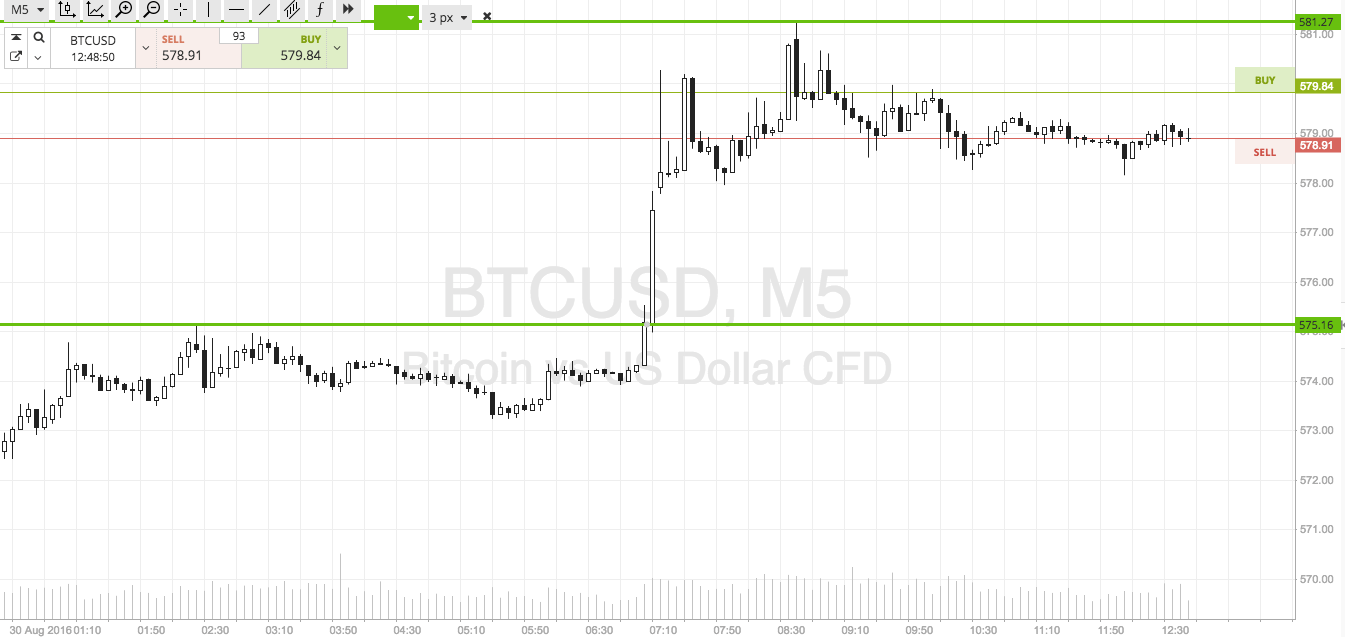

As the chart shows, we are looking at an intraday range as defined by in term support to the downside at 575 and in term resistance to the upside at 581.
If price breaks above in term resistance, we will look to get in long on a close above that level towards an immediate upside target of 587. A stop loss on the position somewhere in the region of 579 will ensure we are taken out of the trade in the event that price reverses and we return to trade within our range (as was the case yesterday on our chop outs).
Conversely, if price breaks and closes below in term support we will get in short towards a downside target of 570. Again we need a stop loss, and we are looking at 577 as a decent risk defining level.
Happy Trading!
Charts courtesy of Trading View