So that’s another day drawn to a close in the bitcoin price space and it’s time to take the second of our twice daily looks at how bitcoin has performed over the last twelve hours or so and how we can interpret this action and formulate a strategy with which we can try and draw a profit from the markets going forward.
In a nutshell, things have been relatively flat over the last few days.
We’ve seen price bump around its target ranges and the odd breakout has given us something to trade now and again but – as compares to the action we saw throughout the week last week – things have been relatively low key so far.
The hope is that this will change heading into the weekend and that, in line with this change, we’ll get a substantial uptick in volatility.
So, with this noted, let’s get the levels in place that we intend to use for the session going forward.
As ever, take a quick look at the chart below before we get started so as to get an idea where things stand and where we are looking to jump in and out of the markets if and when things move.
The chart is a one-minute candlestick chart and it has our primary range overlaid in green.
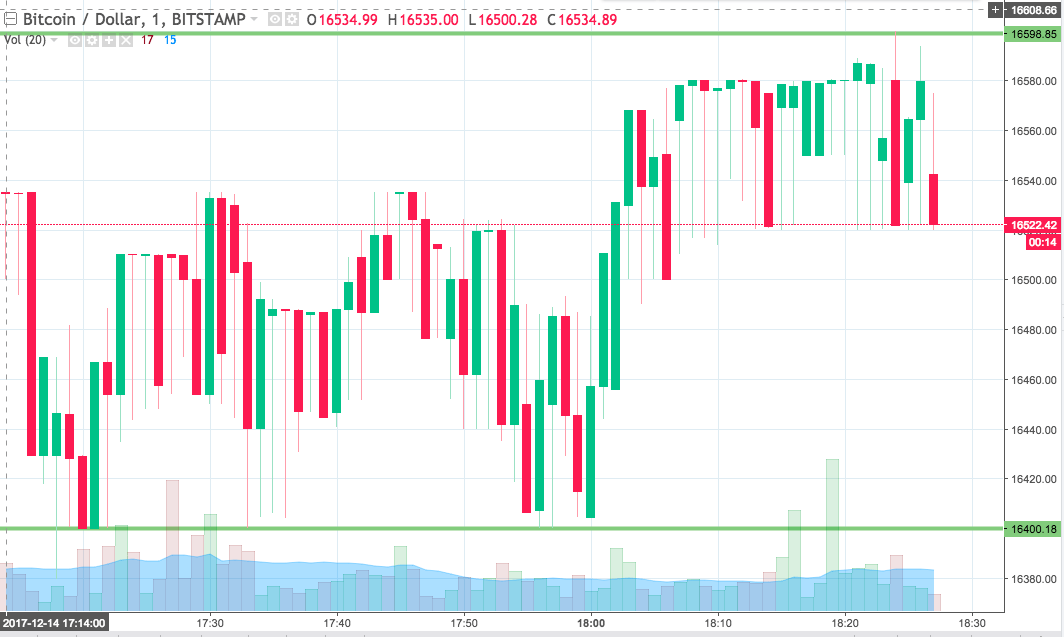

As the chart shows, the range we are using for the session this evening is relatively unchanged from that which we outline this morning.
Specifically, we are looking at support to the downside at 16400 and resistance to the upside at 16598.
If we see price close above resistance, we will get in long towards an immediate upside target of 16650. Conversely, a close below support will have us in short towards a downside target of 16350.
Let’s see how things play out.
Charts courtesy of Trading View