We are closing in on the end of the European session on Monday and it’s time to take the second of our twice daily looks at what’s going on in the bitcoin price and where things stand from a value perspective at this point.
Instead of spending too much time on that, however, we’re going to dive right in. Readers will see why shortly.
So, take a quick look at the chart below to get an idea what happened over the last few hours or so.
It’s a one-minute candlestick chart and it’s got our primary range overlaid in green.
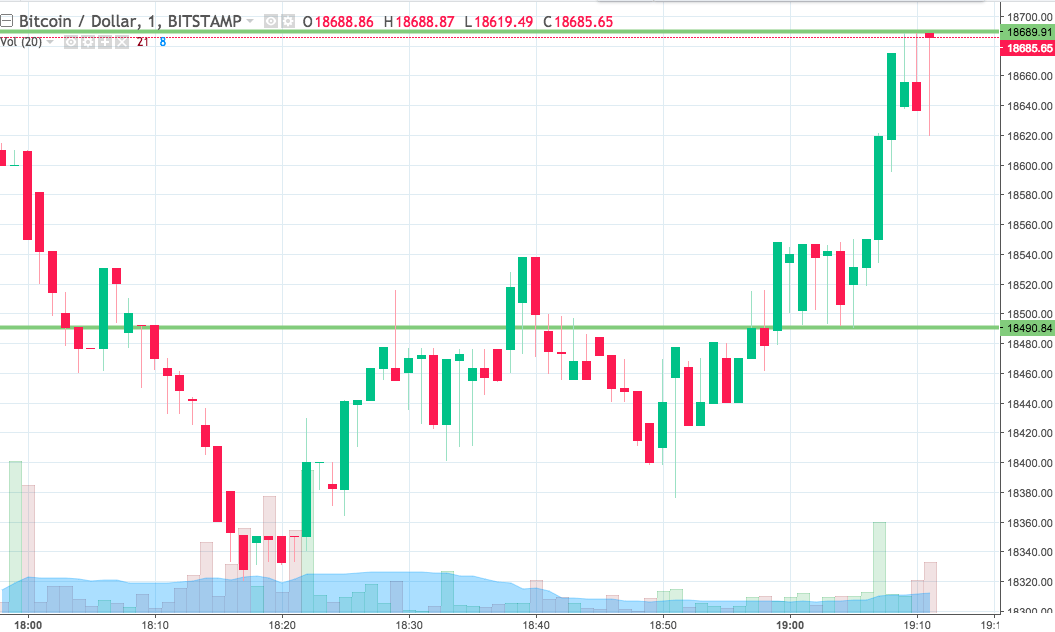

As the chart shows, then, the range we are using for the session today comes in as defined by support to the downside at 18490 and resistance to the upside at 16689. Now that the range has been revealed, it becomes instantly clear why we’re jumping straight into the action this evening – because the current candle could be an entry signal if things play out favorably.
Our standard breakout strategy dictates that we jump in to a long entry if we get a close above resistance. If we see price do that on this chart, then, we’re going to get in towards an immediate upside target of 18775. A stop loss on the trade at 18660 will ensure that we get taken out of the position if things turn against us.
Looking the other way, we’re going to look at getting in short on a close below support. We need a stop loss on this one as well (to help us avoid getting caught out on the wrong side of a reversal) and somewhere in the region of 18520 looks like it should do the job.
Let’s see how things play out this evening and we’ll update accordingly as things kick off tomorrow.
Charts courtesy of Trading View