So the day has drawn to a close, and it’s been a bit dull. Some days, action in the bitcoin price is flat and we don’t manage to get in to any real breakout entries. Friday was a bit like that, and with action over the weekend spiking through support, we went into today’s session expecting some decent momentum plays. Unfortunately, we didn’t get what we wanted, and price has remained relatively flat.
We’re going to head into this evening’s session with some fresh levels, and see if we can’t pull a profit from the market.
As ever, take a quick look at the chart below before we get started, and then we’ll get in to the detail.
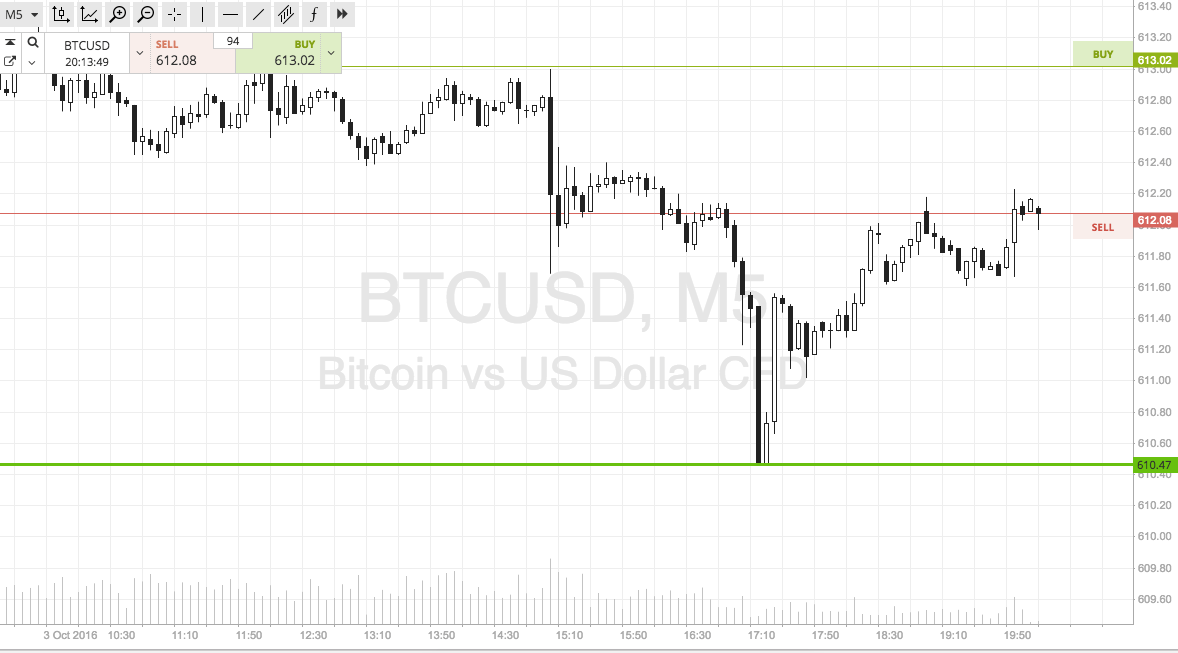

It’s a five-minute candlestick chart with about twelve hours’ worth of action.
As the chart shows, the range we are looking at is defined by in term support to the downside at 610, and we’re going for resistance at 615. There’s five dollars of room between the two key levels, so we can just about get in on an intrarange entry. Specifically, if price bounces from support we will look to get in long towards an immediate upside target of resistance. Same, but opposite, for a correction from resistance. We need a stop loss on these tight positions to ensure that we are taken out of the trade if price reverses to trade back within our focus range. 617 for the short entry, and 608 for the long entry.
Moving over to our lead strategy, if price breaks through resistance, we will get in long towards an upside target of 620. A stop on this one somewhere around 612.5 works well to define risk on the position.
Looking the other way, if we get in short on a break of support, we’ll target a downside target of 605. Again we need a stop here, so 612 looks good.
Charts courtesy of SimpleFX