After this morning’s brief correction, it looks as though things are getting back on track in the bitcoin price. There’s been plenty of volume, so we’re not going to see any action that’s too choppy, and there’s been some decent momentum around to get out levels outlined. We’re not going to do too much rambling this evening. Generally, we discuss a little about how action played out today, but to be honest, there’s not that much to say. After this morning’s dip we saw a bounce to the upside, and this peaked out at a little over 1063. Price then dipped from there to bottom out just ahead of 1045, and after a little bit of up and down, price once again found support just ahead of 1050. Which brings us to our focus levels.
As ever, take a look at the chart below to get an idea of what’s on, and where we are looking to get in and out of the markets according to our strategy this evening. It’s a five-minute candlestick chart with around twelve hours’ worth of action shown.
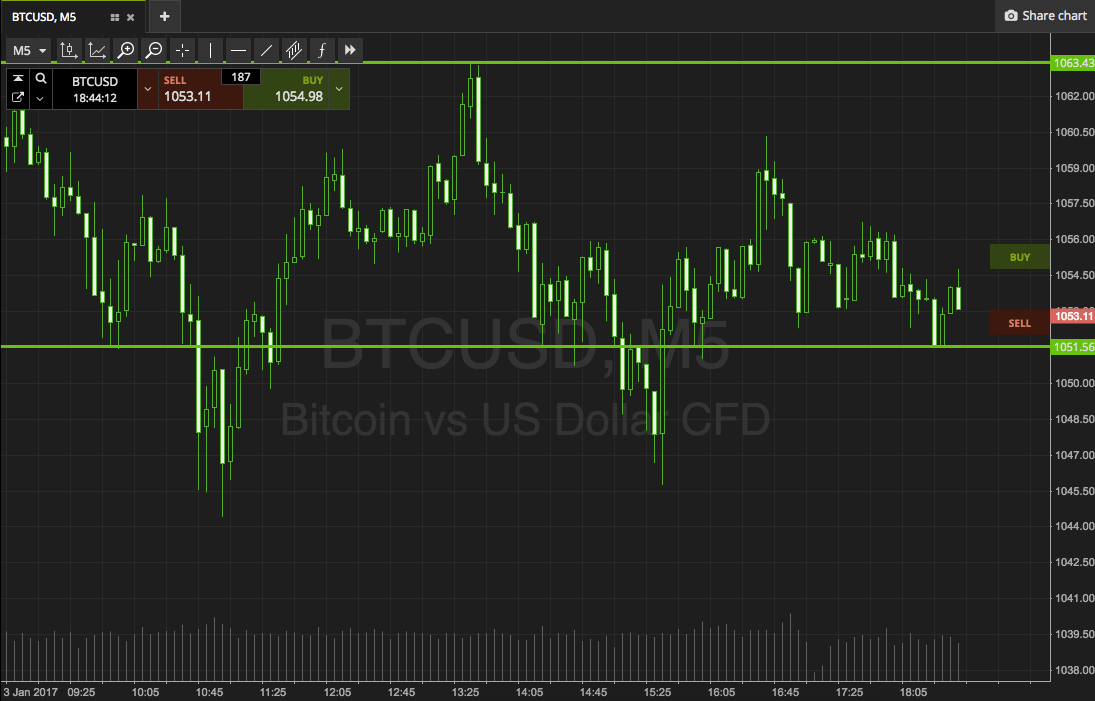

We’re currently trading mid range between our evening support and resistance levels, coming in at 1051 and 1063 respectively. There’s enough room to go at things with an intrarange approach, so the more aggressive trades are on the table for a trader looking to take advantage of any sideways action. Long at support, short at resistance, stops just the other side of the entry.
Looking at our breakout strategy, if we see price close above resistance, we will look to get in long towards 1072. Conversely, a close below support will put us in short towards 1042. A stop on these trades just the other side of the key levels (say two or three dollars either way) will ensure we are taken out of the trade in the event that price reverses to trade against us.
Charts courtesy of SimpleFX