Ok, the end of another week is here, and it’s been a great one for us intraday traders. Price hasn’t stayed still for long, and when it has, it’s generally been on the back of some solid momentum runs, so we expect consolidation here and there. We’ve got the remainder of the US session left to pull out some final cash from the markets, and with any luck, we’ll be able to set up against action and do just that. We’re coming off the back of a strong week, however, so if nothing presents itself as tradeable, we’re not going to rush into any positions.
Without any further ado, then, let’s get some levels outlined and see where price takes us. The chart below is a five-minute candlestick chart – which is the one we seem to be using as standard these days, although there’s always the potential for us to switch out to a wider fifteen-minute chart if price allows – and it’s got our range overlaid in that lovely bright green color we always seem to use (note to self: change that).
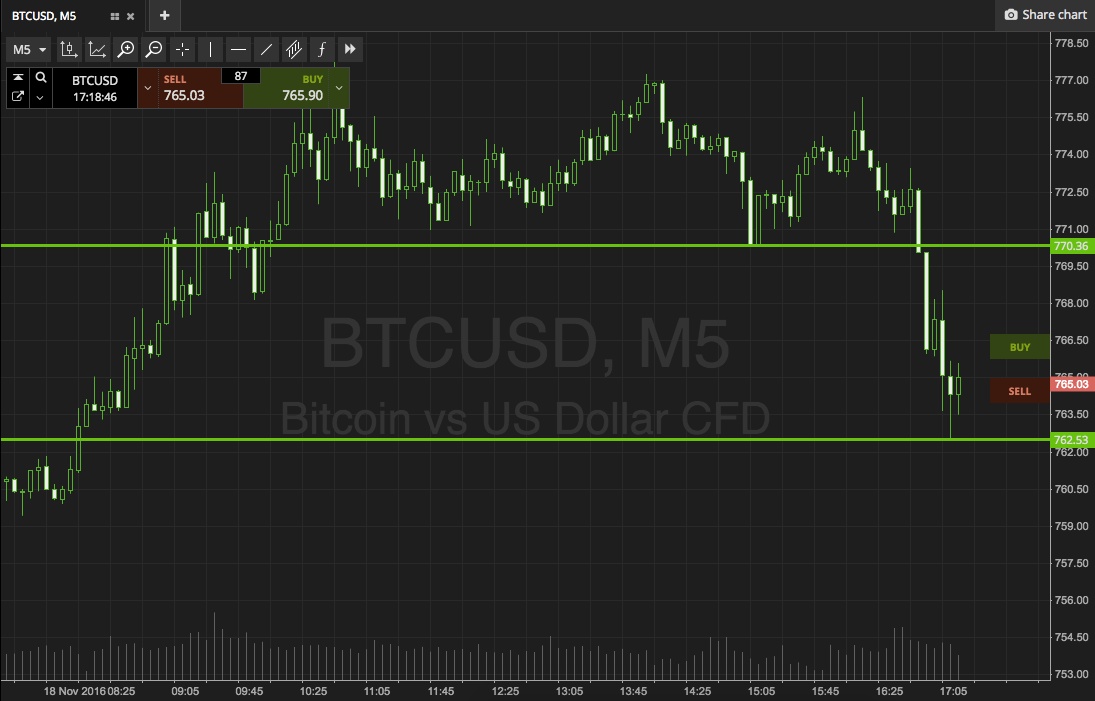

So, as the chart shows, the range we are looking at this evening is defined by in term support to the downside at 762 and in term resistance to the upside at 770. Breakout scalps only for the session, and nothing too dramatic. So, long on a close above resistance with an immediate upside target in place at 777. A stop somewhere in the region of 768 keeps risk tight, and ensures we are taken out of the trade if price reverses against our bias.
Looking south, if price breaks support, we’ll watch for a close below that level to get us in short towards a target of 755. Again we need a stop, and somewhere around 764 works well.
Happy trading ladies and gents!
Charts courtesy of SimpleFX