The regular readers out there will be aware that for the last few days, we’ve been looking at the 1100 and the 1200 levels as key forward looking levels. What we mean by this is that the way the bitcoin price responds to the reaching of these levels will give us some degree of insight into what we can expect near to medium term going forward. For example, if we see a break of the 1200 level, we expect price will run up to in and around the 1250 mark relatively quickly. Not right away, but it will get there. Conversely, if we see a correction form that level post-hit, price will probably run down to the 1150 region before it breaks again.
The same is true at the 1100 level, and the latter is pertinent right now, as we’re trading in and around said level at present.
We’re hoping the bitcoin price can hold above 1100, as it will also indicate some degree of longer term support in this region.
Whatever happens, we’ll be ready for it.
So, as we move into the European session today, here’s a look at what we are going for, and where we are looking to get in and out of the markets according to the rules of our intraday strategy today.
As ever, take a quick look at the chart below to get an idea of what’s on before we get moving. It’s a five-minute candlestick chart, and it’s got our key range overlaid in green.
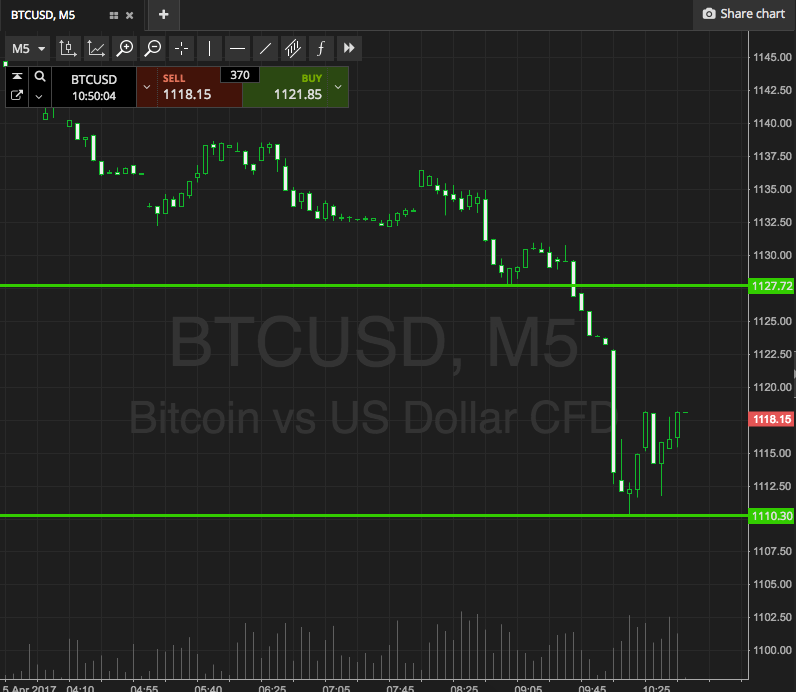

As the chart shows, the range we’ve got in place today is defined by support to the downside at 1110 and resistance to the upside at 1127. A close above resistance will put us in long towards 1140. Conversely, a close below support will signal short towards 1100 flat. Stops just the other side of the entries define risk on both positions.
Charts courtesy of SimpleFX