In this morning’s analysis, we discussed the pretty flat action that we had seen in the bitcoin price across the last few days. After the pretty wild weekend we saw just gone, when price broke through to fresh highs and reached upwards of 600 on some exchanges, action has traded sideways between a pretty tight range, and this left us with very little to go at ahead of this morning’s open.
Action today has given us a bit more to discuss, however, so let’s get to it.
Specifically, the price range we outlined this morning. In term support broke a little while ago, and we entered short towards our predefined target. As such, we won’t be looking at a fresh entry before this one closes out – either be it through a stop loss hit or a target take out.
For those that aren’t currently in a position, however, here’s a look at what we are going for this evening from a key levels perspective.
As ever, take a quick look at the chart below to get an idea of the primary range, and the targets we are looking at for any trades post close of our current. It’s a fifteen-minute chart showing the last twenty-four hours’ worth of action in the bitcoin price.
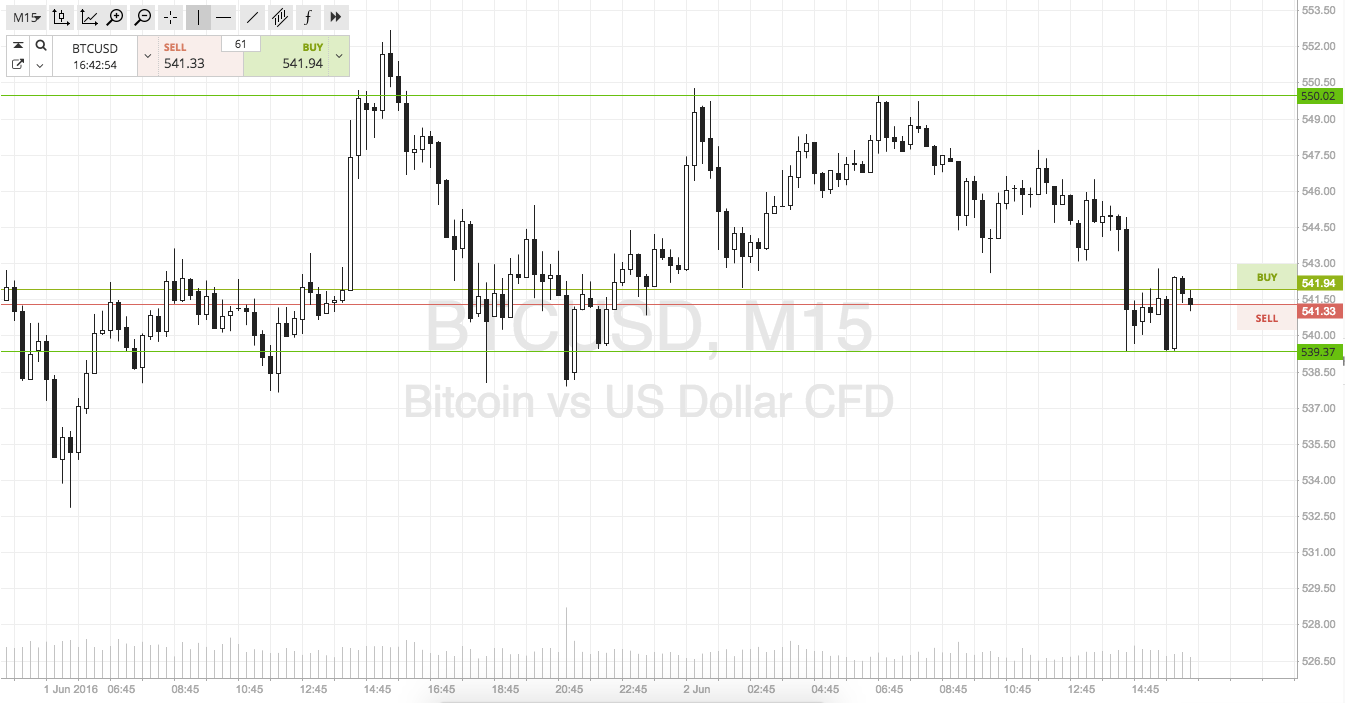

So, as the chart shows, the range in question this evening is defined by in term support at 539.37, and in term resistance at 550 flat. It’s a wide enough range to bring intrarange into play, so long at support and short at resistance, stop just the other side of the entry.
Looking at breakout, if price closes above resistance we will enter long towards an initial upside target of 557 flat. Stop at 547.
Looking south, a close below support signals short towards 532. Stop at 542 to keep tihngs tight on the risk side of the position.
Charts courtesy of SimpleFX