In this morning’s analysis, we noted that the latest action in the bitcoin price allowed us to bring a step-up strategy into play; specifically, shifting our key levels to the upside on every move in line with the overarching bias, in anticipation of a continuation. Unfortunately, we seem to have come to a corrective phase, and that’s made our strategy difficult to execute. We got into a trade a little earlier today, but having failed to pick up any real upside momentum, the bitcoin price broke back to the downside and took out our stop. Having said this, we bounced from the level we slated as resistance and now trade at a level pretty much identical to where we started the day – mid range on this morning’s definition.
This gives us an opportunity to replay this morning’s strategy this evening, with some slightly altered levels that take into account recent movements. So, as we head into tonight’s session and beyond into the Asian Friday morning open, where are we looking to get in and out of the markets on any volatility? Take a quick look at the chart to find out.
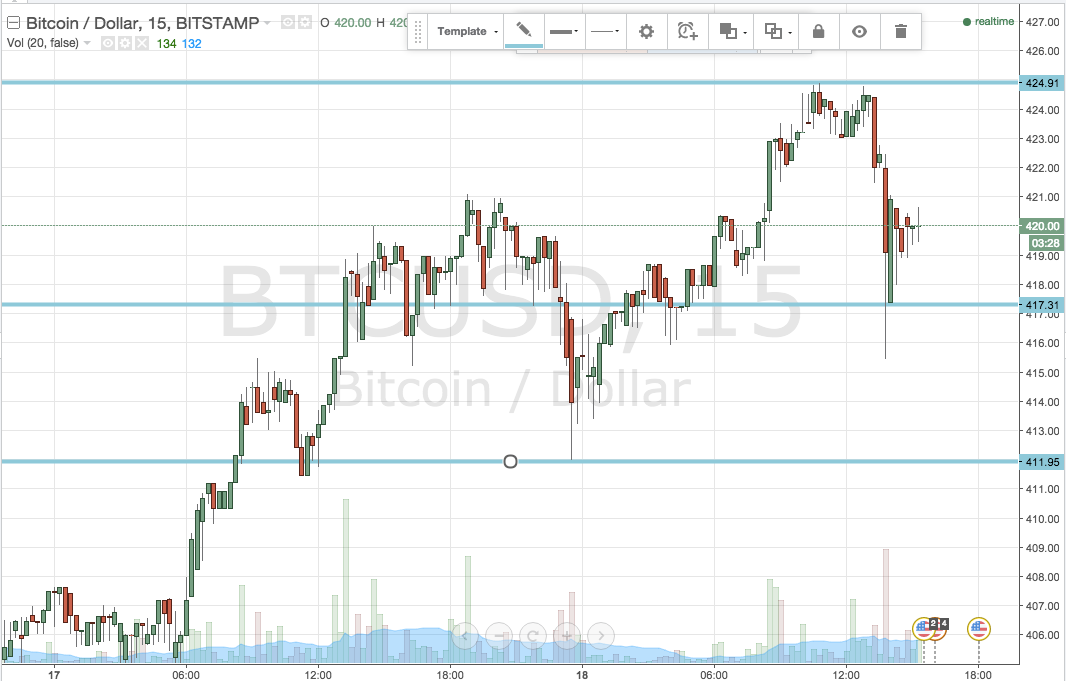

So, as the chart shows, we’ve shifted the range we defined this morning slightly to the upside, and are now using the most recent swing high (the failed upside break) as in term resistance – specifically 424.91. To the downside, 417.31 gives us in term support. We could go as low as 415 for this one, but 417 is a little more aggressive.
So, to the upside, if we can break and close out above in term resistance, it will put us in a long entry towards 430 flat. With a nice fundamental kick, there’s no reason we can’t hit this level and beyond before the close of the US session.
To the downside, a close below support at will put us short towards an initial downside target of 412 – the most recent spike down and a nice distance from entry. A stop on this one just above support defines risk.
Charts courtesy of Trading View