After what started off as a promising week in the bitcoin price and our intraday strategy, but as the week went on things got a little choppy. We slated two technical charting patterns that have a decent rate of success – the head and shoulders pattern on Wednesday and the triangle pattern during yesterday afternoon, and while both completed (in the sense that they validated and we got an entry) they went on to take out our stop losses in both instances. Whether we’ll get a little more fortune over the weekend remains to be seen – I predict we might not see much volume and this might translate to some pretty weak momentum? Why? Because there is discord in the bitcoin space at the moment, and this might weigh on people’s sentiment. If anything, we will likely see some selling pressure as people unload any speculative coin holdings while the whole classic/core debate plays out.
For us, from a technical intraday perspective, this means we might not be able to get in according to our breakout rules. Obviously this is just a prediction, and far from set in stone, but it seems valid given the underlying fundamental environment. Whatever happens, we are happy to set up against any sort of movement, define our key levels and wait and see. So long as our targets aren’t overly aggressive, and our stops remain tight, we won’t get on the losing end of anything irretrievable – and that’s what matters.
So, with all this said and out of the way, what are the levels we are looking at in today’s bitcoin price (European afternoon session) and where will we look to get in and out of the markets according to our breakout strategy today? As ever, take a quick look at the chart to see what we’re setting up against. It’s an intraday, 15-minute chart, with a 48-hour frame of reference.
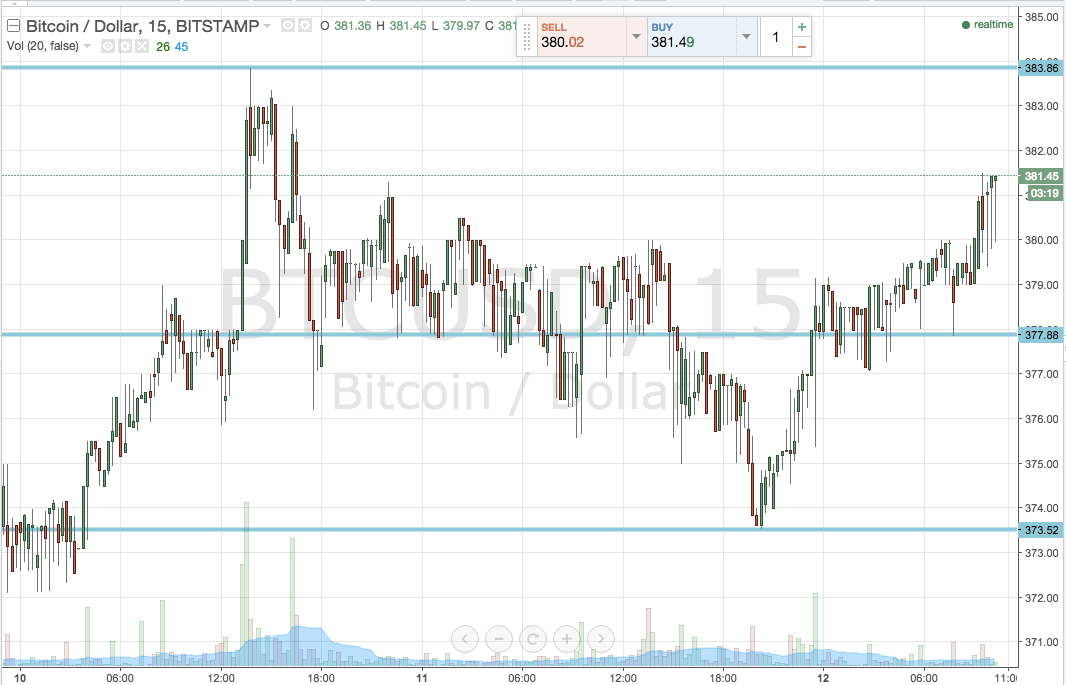

As the chart shows, we’re just going back to basics for this Friday session. No patterns, just a couple of key levels to define the day’s range and some reasonably conservative targets to head for on an entry. In term support is defined to the downside as 377.88, while in term resistance comes in about six dollars north, at 383.86 – a level that gave us the most recent spike high mid week.
We’ve got enough room to bring our intrarange strategy into play (just about) so if you want to implement some range bound scalps, a long trade on a bounce from support and a short trade on a correction from resistance looks good. Stops just the other side of the entry to define risk.
From a breakout perspective, a close above in term resistance will put us in a buy position, with an immediate upside target of 390 flat. A stop somewhere in the region of current levels, or maybe a little above (say, 381 flat) defines risk.
Looking the other way, a close below support will signal a short entry towards 373.52, and a stop at 380 keeps things tight on the upside.
Charts courtesy of Trading View