We’ve had a pretty crazy few weeks in the bitcoin price space, and this has translated to some volatility in the effectiveness of our strategy. We have seen some macro events – the Brexit, politics in the US, etc. – and some micro shocks such as the ethereum hack and the Bitfinex freeze, and each of these has impacted the price of bitcoin in their own way. We were looking for some risk off sentiment towards the end of last week, and in turn, a shift to bitcoin as a risk off (safe haven) asset. We saw a little bit of this post UK referendum, as price recovered on its losses a little bit to pull back some of the losses it had made throughout the earlier half of the week. As the weekend action played out, however, this safe haven suggestion fell through a little, and price once again started to decline. Sunday saw midday lows of circa 620, the lowest price seen since mid last week. So, with this said, and as we head into a fresh week of trading in the bitcoin price, where are we looking to get in and out of the markets? As ever, take a quick look at the chart to get an idea of our focus levels. It’s a fifteen-minute candlestick chart looking at the last forty-eight hours worth of action.
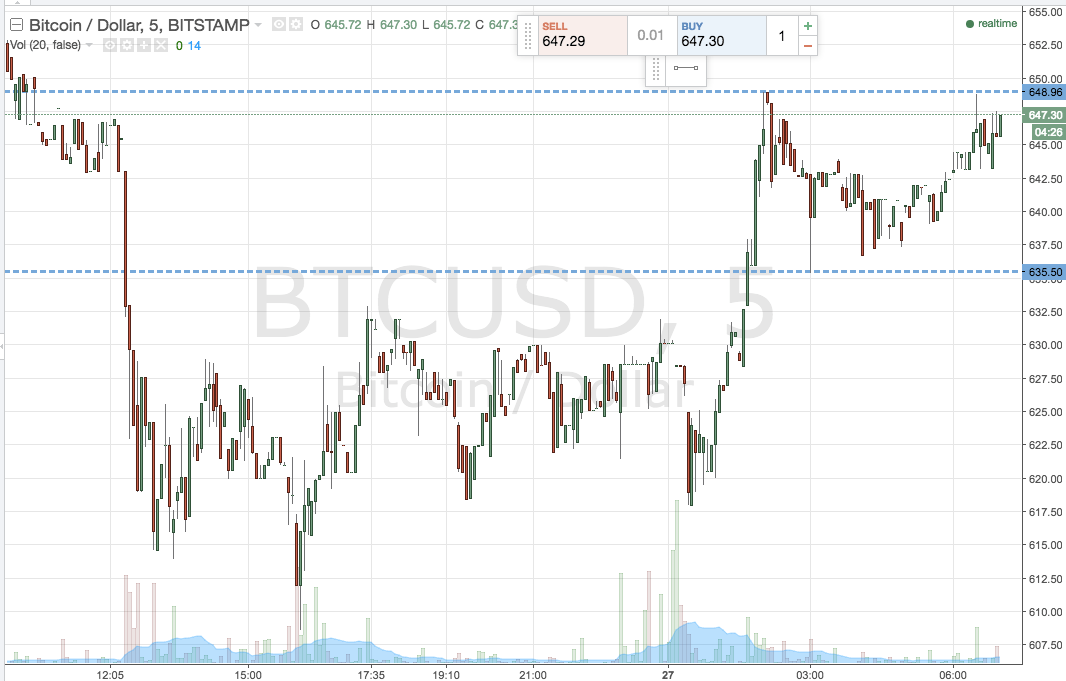

So as the chart shows, we are watching 635 as support to the downside, and 649 as our upside resistance level. We are going to focus purely on our breakout strategy today, rather than look intrarange.
Specifically, if price closes above resistance we will look to enter long towards an initial upside target of 658. Looking south, if price closes below support, we will enter to the downside with a target of 625 and a stop loss at 637 to define our risk on the position.
Charts courtesy of Trading View