So that’s the weekend over, and it’s time to get back to our intraday bitcoin price analysis. Things were pretty good last week, as conditions afforded us numerous opportunities to get in and out of the markets on volume driven volatility. Admittedly, volume wasn’t quite as high as we would have liked to have seen at peak times, and this limited our potential reward on our most active positions, but we altered our approach a little to incorporate scalp targets, so this wasn’t too much of an issue. Tight targets, quick trades the order of the day/ For today’s session we are going to maintain this approach. There’s not been anything fundamental that will play on volume (nothing major, at least) so it’s reasonable to concluded that there won’t be too much upside on offer when we enter.
What did action over the weekend give us to go on? Well, price traded relatively flat the whole weekend, and sideways just shy of 665 throughout the evening, before falling to carve out weekend lows around 655 – a level we will come back to shortly.
Take a quick look at the chart below to get an idea of what happened last night, and to see the key levels in focus for today’s session. The chart is a five-minute candlestick chart, with the key levels overlaid in green.
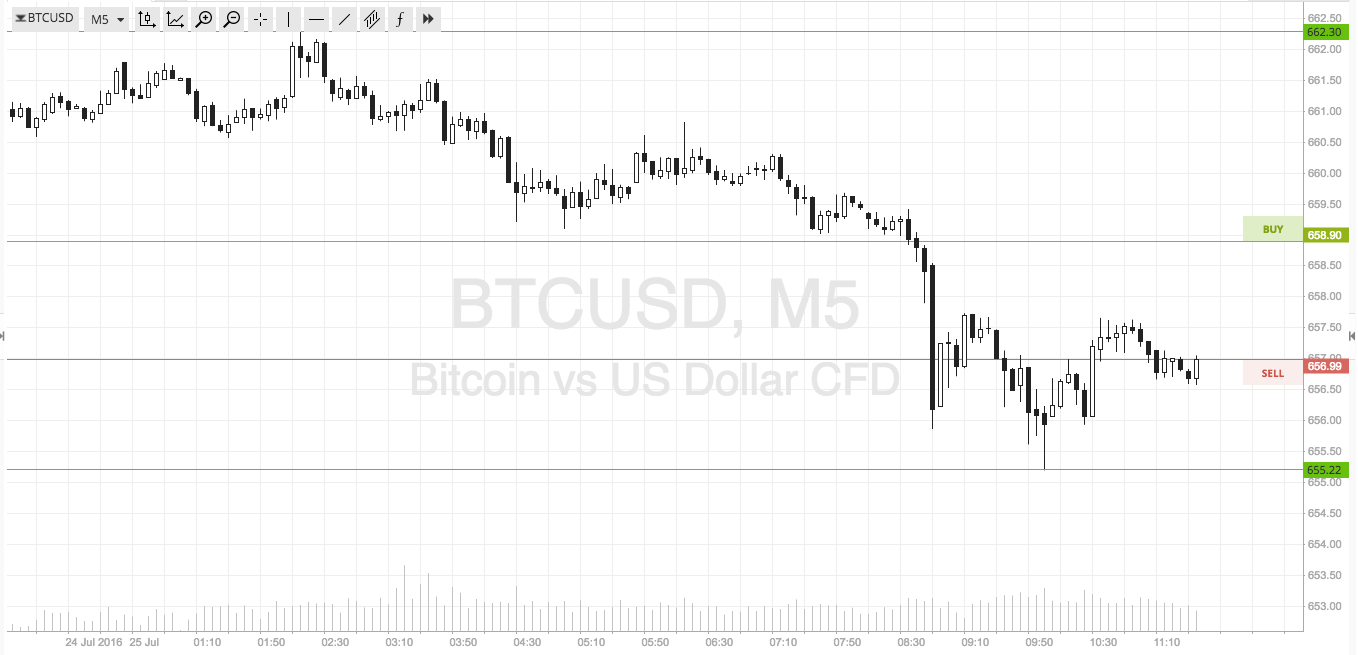

As the chart shows, for today’s European morning session, we are looking at in term support to the downside at the above mentioned 655, and in term resistance to the upside at 662. It’s a pretty tight range, so let’s stick with a pure play breakout strategy today.
Specifically, if price breaks below support (looking the more likely trade as things stand) we will enter short towards a target of 650 flat. Similarly, a close above resistance will put us long towards 670.
Charts courtesy of SimpleFX