So that’s another day done in the bitcoin price markets (at least out of Europe) and there’s been plenty of action during today’s session that we can look at, and use for tonight’s late US trading. Instead of rambling on like we normally do in this part of the analysis, we’re going to get straight to the action. Get a look at the chart below before we do, so as to ensure you’re familiar with the levels we are focusing on, and the action that’s brought us there throughout today’s European session.
So, let’s get going. The chart is a five-minute candlestick chart and it’s got our key levels highlighted, with around twelve or so hours’ worth of action displayed on the time frame.
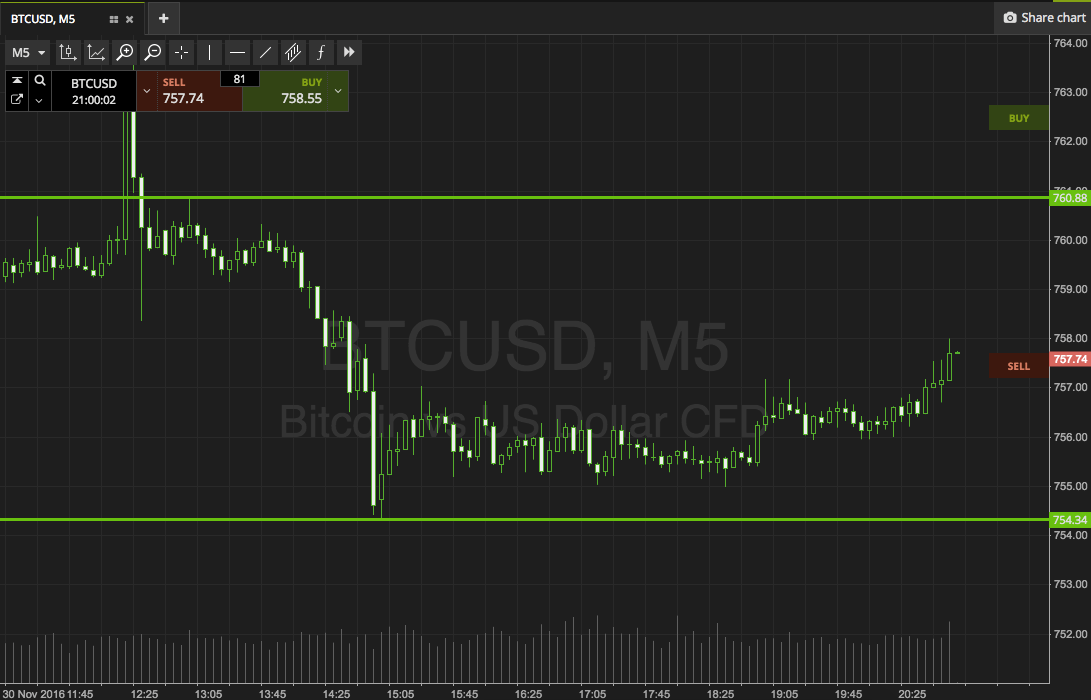

As the chart shows, the range in focus for this evening’s session out of the US is defined by in term support tot the downside at 754 flat, and in term resistance to the upside at 760. That’s a pretty tight range, but for a little bit of fun we’re going to go after price with an intrarange approach. Specifically, if price bounces from support, we’ll look to get in long towards an immediate upside target of resistance. On the position, a stop loss just the other side of the entry (somewhere in the region of 752) will ensure we are taken out of the trade in the event of a bias reversal. Conversely, a correction from resistance will put us short towards support. Again, a stop just the other side of the entry kills off risk.
If price breaks through resistance as opposed to corrects from it, we’ll target 767 to the upside. Stop at 757. A close below support will get us in short towards 748.
Let’s see how thing splay out this evening and we’ll rejig our primary levels in the morning to accommodate overnight action.
Charts courtesy of SimpleFX