So it is Wednesday morning, and time to take the first of our two looks at the bitcoin price. Action this week has been relatively dull. We have seen some up and down action, and a few decent scalp entries have enabled us to draw a quick profit on the market. However, other than that, there hasn’t really been any sustained momentum moves, and the profits we have pulled out of the market have been pretty small. Of course, this doesn’t mean that we are going to see this sort of action all week. There are three days left, and every one of these could be high octane from a trading perspective, so we have to maintain our strategy and push forward.
So, with that said, and as we head into today’s morning European session, here a look at the levels in focus, and a discussion of where we’re going to get in and out of the markets according to our intraday strategy if price gives us some signals. As ever, take a quick look at the chart below before we get started. It is a five-minute candlestick chart with around 12 hours’ worth of bitcoin price action displayed, and it has our range in focus for today’s morning session overlaid in green.
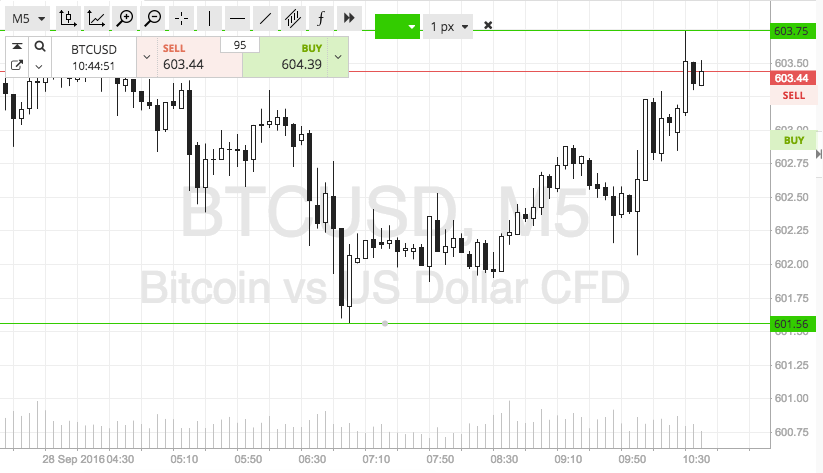

As the chart shows, the levels we are looking at this morning as defining our first session’s range are support to the downside at 601 and resistance to the upside at 604. Yesterday, we managed to get a range that was just wide enough to allow us to bring our intrarange strategy into play. However, for today’s session, we’re going to focus purely on breakouts. Why? Because our range is slightly too narrow for us to approach any intrarange action with a positive risk reward profile.
So, specifically, we’re going to get in a long position on a break of resistance towards an upside target of 610. Conversely, if price breaks support, we’re going to get in short towards an immediate downside target of 596. Stop-losses just the other side of each entry to define risk.
Charts courtesy of SimpleFX