Yesterday afternoon we noted that action in the bitcoin price seemed to have tightened up, and that as a result, we were going to tighten up the ranges we were trading (alongside our risk management and target parameters) to accommodate these conditions. The hope was, that by tightening things up, we would be able to get in on any volatility, however small, and draw a quick profit from what look to be very uncertain markets. As it turns out, things didn’t work out quite as we’d hoped.
The bitcoin price remained pretty much within the range we slated as the one to watch overnight, until a short while ago, when it gapped through resistance and closed above, putting us in a long trade towards our predefined target of 430 flat. Almost immediately, however, it gapped back down to trade within range, and we’ve literally just had our stop taken out for a small loss (stop was just ahead of 422 flat).
This makes things tricky for today’s session. We’ve said it before, and we’ll say it again, when we get sideways action like this it suggests a big movement could be on the cards. This is what we are aiming to trade today.
So, with this in mind, what are the key levels we are focusing on? As ever, take a quick look at the chart to get an idea of what we are watching, and to see last night’s trade and today’s stop hit.
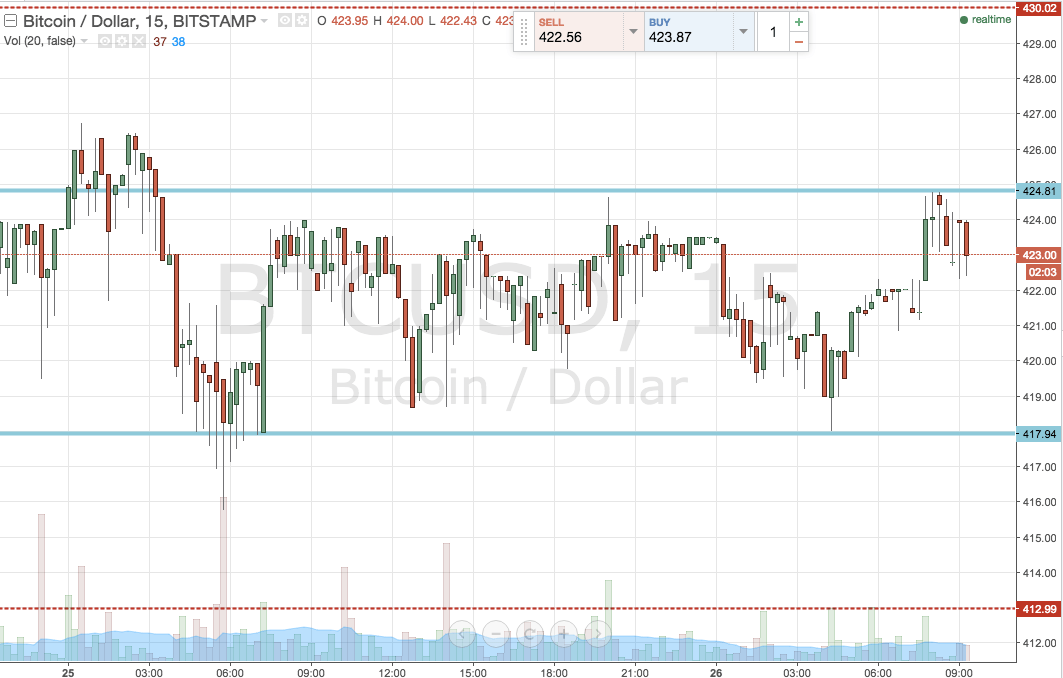

So, as the chart shows, the range we are looking at today remains almost identical to that we slated last night, with one exception – we are going to shift in term resistance to the upside to accommodate the false break.
So, in term resistance comes in at 424.81, while support sits at 418 flat.
A close above the former will signal a long entry towards yesterday’s initial upside target at 430. Stop at 422.5 defines risk.
Shortside, a close below support will signal a downside position towards 413 flat, with again a stop required – somewhere in the region of 419.5 looks sound.
Charts courtesy of Trading View