Tuesday is now pretty much over from a European perspective, and things have been a little slow today. We were hoping to get a couple of opportunities to get in to our intraday strategy rules, and continue our run of profit taking that kicked off on Monday and played through until yesterday evening.
We’re hoping that the sideways trading that we saw today is representative of a type of coiling, and that this coiling will break out under the buy and sell side pressure building up. When this sort of thing happens, we often see sharp breakouts, and they can be the beginnings of some nice upside momentum trades.
Of course, this is all just speculative talk – things could play out just as they have today and we end up remaining flat on the markets. Our range tonight is a little too tight for intrarange action, so if this does play out, then we’re not going to get into any trades and – in turn – we’re in for a pretty dull night.
Anyway, let’s get to the detail and see what we’re setting up against. As ever, take a look at the chart below to get an idea of what’s on, and where we are looking to get in and out of the markets according to our standard strategy rules.
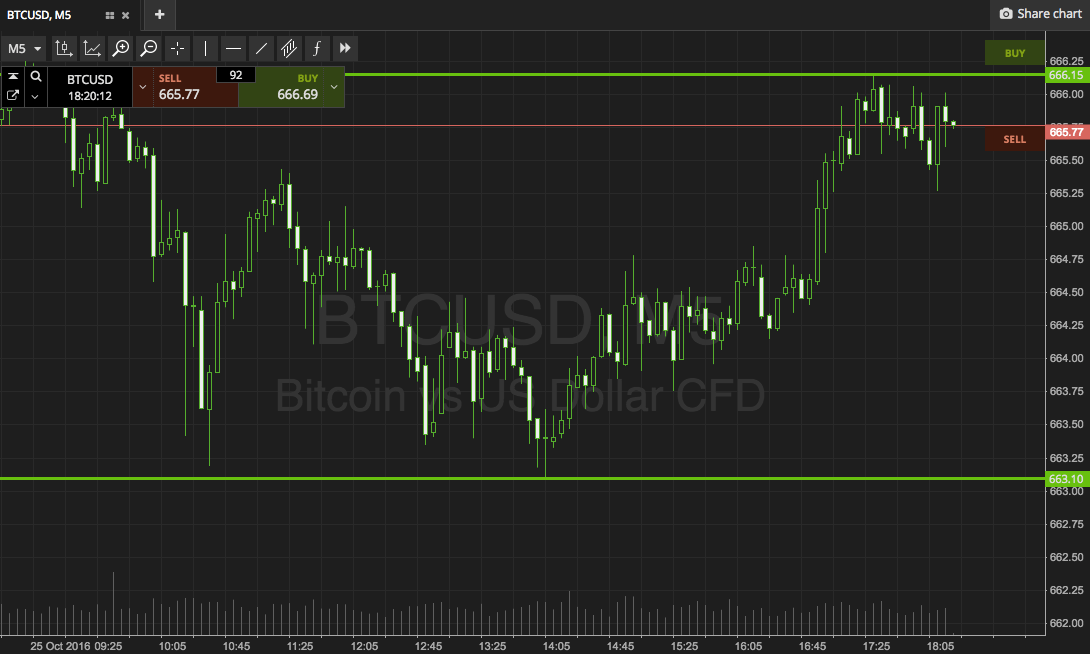

As the chart shows, the tight range we are looking at s defined by in term support to the downside at 663 flat, and in term resistance to the upside at 666. This is pretty much our tightest possible range given the bid ask, so we’ve got to be equally tight with our risk management parameters.
If price breaks through resistance, we will look to get in long towards 670 with a stop at 665 flat. Conversely, a close below support will put us short towards 659 with a stop at 664 managing our upside.
Charts courtesy of SimpleFX