Ok, we’re going to do something a little different this evening and bring readers in on a live trade, as and how it plays out. Normally we set up the levels for the session ahead in this second coverage piece, but the charts just gave us an opportunity (well, perhaps, more on this shortly) to get in on a long trade (which readers will know is very much in line with our overarching bias) and we’re going to document it in real time as a result.
So, before we get started, take a look at the bitcoin price chart below.
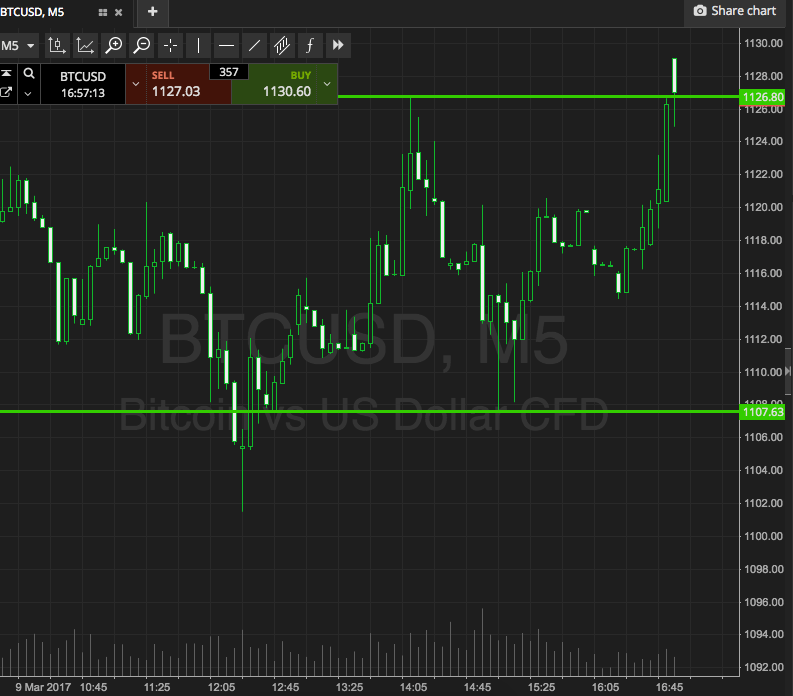

As the chart shows, we’re looking at a range defined by support to the downside at 1107, and resistance to the upside at 1126, and we’re specifically looking at the bitcoin price having just broken through our resistance level.
So here’s how it works. When we see a break like this, we monitor the candlestick to its close. These are five minute charts, so the candlestick will take five minutes to close out. If it closes above resistance, that’s an entry signal to the upside.
When we enter, we always predefine our risk parameters with a stop loss on the downside (this takes us out of the trade automatically if price moves against us) and a take profit to the upside (which again takes us out of the trade, but for a profit). The key is to ensure that the reward side of the trade is larger than the risk side, as this means – over the long run – we are able to lose more trades than we win and we’ll still make money. That’s a fundamental risk management rule, and one that applies whatever market we’re looking at.
So, in this instance, we’ll be in long towards a target of 1136 (ten dollars’ reward) with a stop loss at 1121 (five dollars’ risk) giving us a two to one reward to risk ratio.
Let’s see what happens.
Charts courtesy of SimpleFX