We’re going to jump straight into our bitcoin price analysis for the session this evening since things are moving incredibly fast and – if we don’t jump right in – we’re probably going to miss an entry signal.
As we noted this morning, we’re not really interested in the overarching trend right now – at least, that is, from an intraday perspective. So long as we can get in to short-term entries on any intraday volatility, we can profit from movement in any direction – up or down.
So, with that noted, let’s get right into it.
As ever, take a quick look at the chart below before we get started so as to get an idea where things stand at the moment and where we are looking to jump in and out of the markets on any volatility. The chart is a one-minute candlestick chart and it’s got our primary rang overlaid in green.
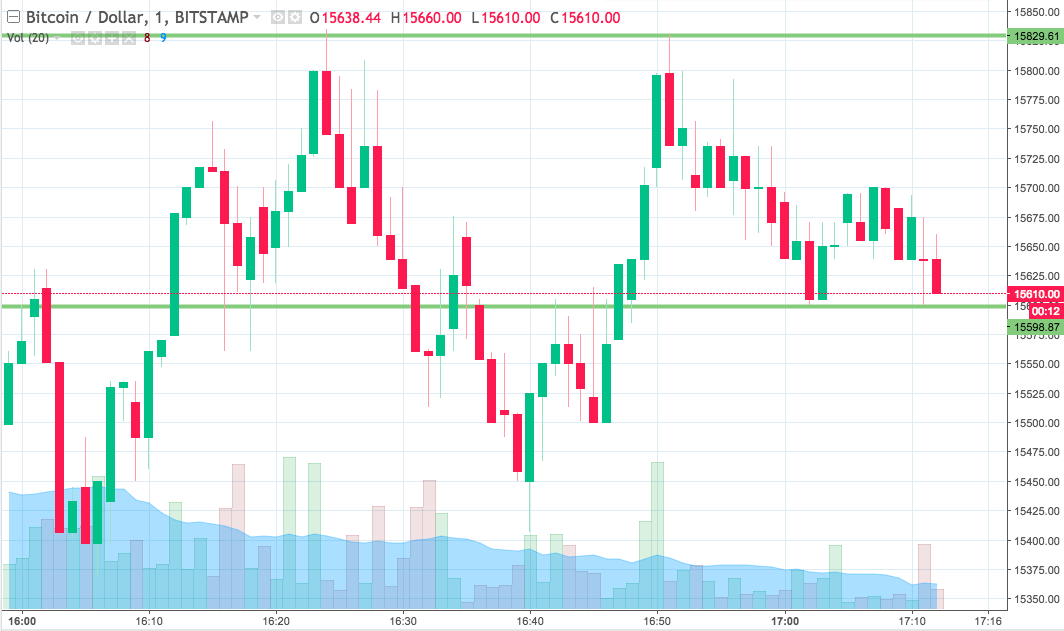

As the chart shows, then, we’re looking at a pretty tight range (as compares to this morning’s) and it’s defined by support to the downside at 15598 and 15829. So we are going to go with our standard breakout approach (just so we don’t get chopped out on the tight range) and this means we enter on a break of, and a subsequent close beyond, the key levels that we just outlined.
Specifically, then, if we see price close below support, we will jump into a short entry. On the position, we will target a downside target of 15500 and we will use a stop loss in and around 15625 to limit the risk we are taking on at entry.
Looking the other way, if we see price close above resistance, it will signal a long trade towards an immediate upside target of 15920. A stop loss on this one at 15800 looks good.
Charts courtesy of Trading View