To kick of the day’s second analysis, we’re going to start with a chart. The image below shows the framework we placed on the bitcoin price earlier this morning, with an overlay of action seen across the last five or six hours.
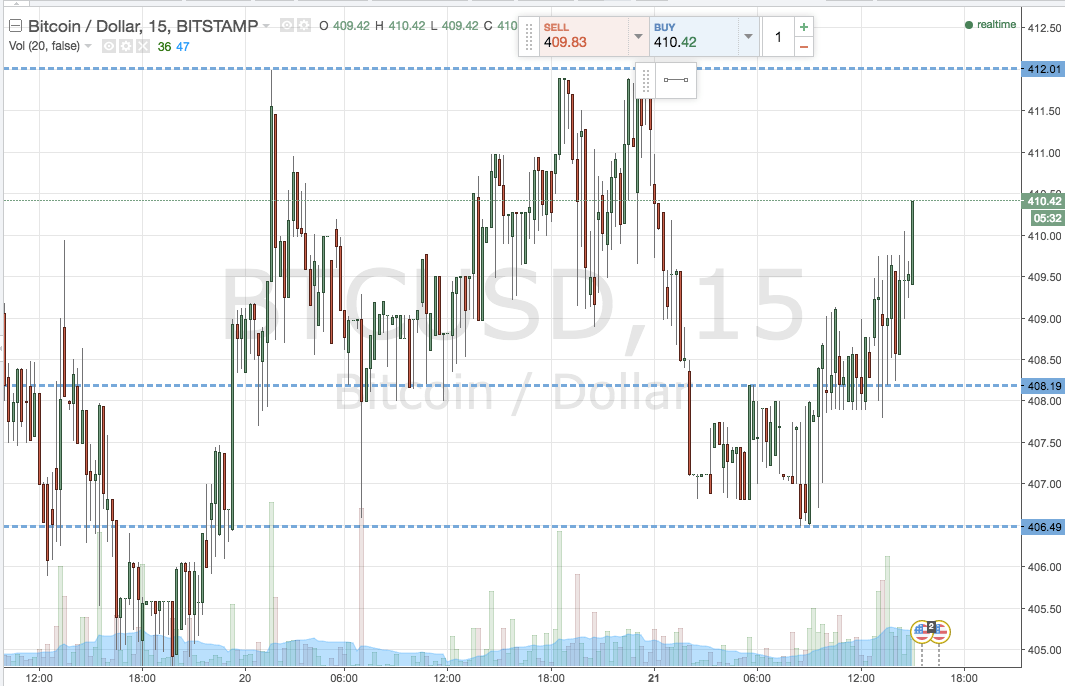

As the chart shows, the bitcoin price broke through our predefined in term resistance level shortly after publication, and has since continued to trend upwards towards our target of 412. It’s a pretty aggressive target on the intraday scale, and we will remain out of the markets until the trade completes (be it through a stop loss hit or a hitting of the 412 level). For those that missed the entry, however, here’s a look at what today’s action suggests about what we might see tonight, and a refreshed framework that takes into account today’s action.
The chart below is a fifteen minute, intraday chart, showing circa the last 48 hours of action. It’s similar to the chart above, but with the refreshed framework highlighted.
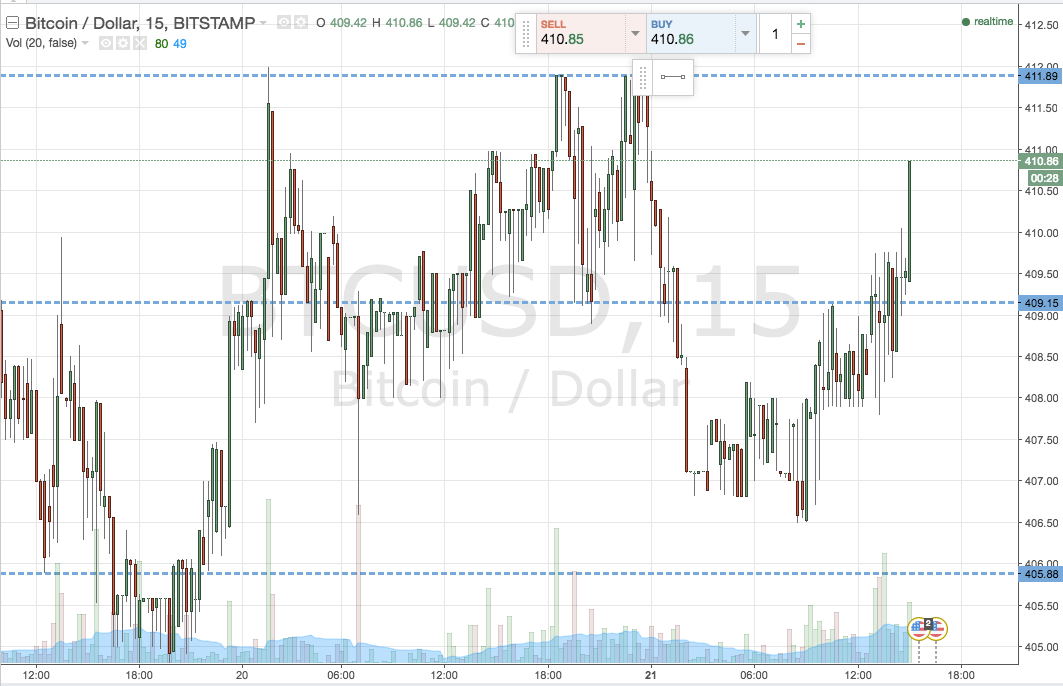

As the chart shows, we’ve shifted up our support and resistance, and in turn range. The new levels to watch are in term support at 409 flat and in term resistance at 412 flat. It’s a three-dollar range, so we are going to focus purely on breakout entries this evening.
Specifically, if we get a close above in term resistance we will look to enter long towards an upside target of 418 flat. A stop around 410 defines the risk on the trade.
Looking the other way, if the bitcoin price breaks in term support and closes below this level, it will signal a short trade towards an initial downside target of 405 flat. A stop on this one somewhere in the region of 410.5 will keep things attractive from a risk management perspective.
Happy Trading!
Charts courtesy of Trading View.