Yesterday afternoon, our bitcoin price watch article highlighted a bunch of key levels, and in the article, we were able to define a classical pattern that suggested – from a technical perspective, at least – we were set for a continuation of the downside break we saw a little earlier in the day. A look at the action that succeeded our analysis shows a mixed response to our predictions. We did get a break below the upwards sloping triangle that we had highlighted as the pattern to watch, but the bitcoin price failed to reach our downside target of in term support. We got within a couple of dollars of taking out the trade for a profit, but reversed within an hour and returned to some corrective strength. For the longer term holder, of course, strength such as this is welcome. For us, and with specific reference to our short entry, it wasn’t so great. Price took out our stop mid-yesterday evening, and action chopped about following our loss. A sliver lining of this choppy action is that it has given us plenty of levels to play with today, and as we write this analysis, we are approaching one such level. Of we can get a break, it will signal an entry, so let’s get to it before the break comes! As ever, take a quick look at the chart to get an idea of what we are looking at.
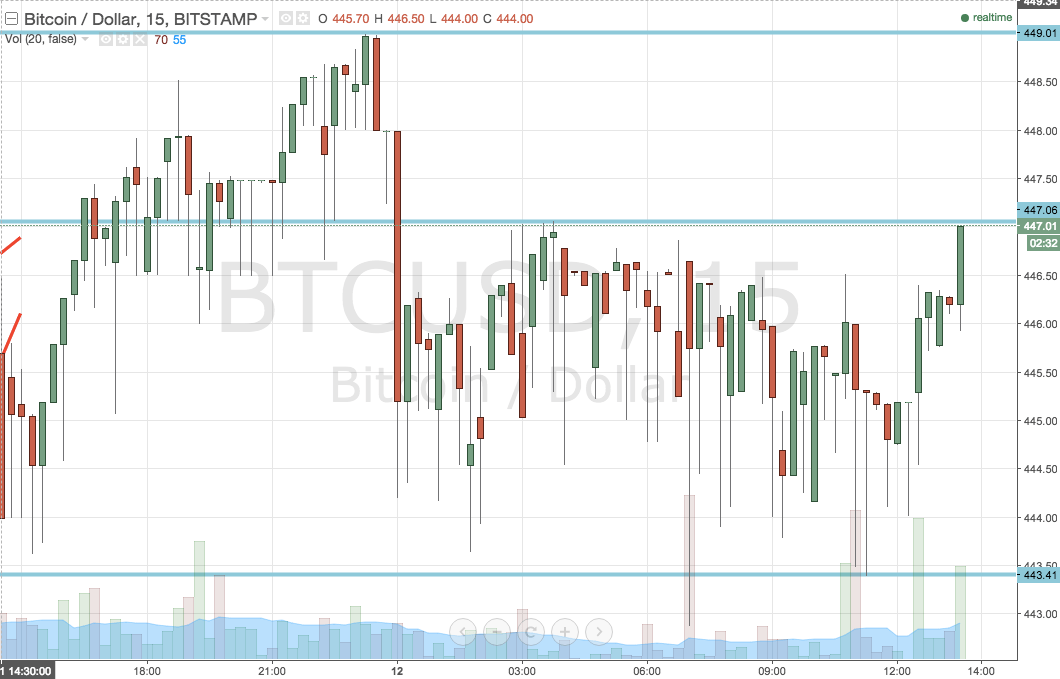

As the chart shows, in term support sits at 443.31 ( the most recent spike down low) and in term resistance at 447.06, which is a level that has served as both support and resistance on a few occasions over the last few days.
It is the latter of these two levels that we are currently trading around, and as such, let’s address the upside action first in an attempt to beat price into a trade.
So, according to our breakout strategy, a close above in term resistance should put us long towards a predefined target. With this in mind, a close above 447.06 will signal a bullish position towards an initial target of 449 flat. This is a real tight scalp trade, and our stop has to mirror this – so a stop somewhere in the region of 446.50 looks good on the position.
If we correct from current levels, we will enter short towards in term support according to the rules of our intrarange strategy, with a target of 443.41 and a stop at 448 flat to define our risk.
Looking the other way, if we run down to support, we will initially look for a close below this level to put us short towards a slightly longer term target (when compared to our upside entry) of 435 flat. A stop around 445 will take us pout of the trade in the event that we get a reversal and return to trade within range.
For the intrarange approach, a bounce from in term support will signal a long entry towards resistance, with a stop just below support – 441 flat looks good – defining our risk.
As ever, charts courtesy of Trading View.
Happy Trading!