In this morning’s bitcoin price watch piece, we noted that we had seen the 400 flat level breached for the first time in a few weeks, and that as a result, our overarching bias took a bullish turn. We set up our breakout and intrarange strategies to gain from any intraday volatility during the European morning and early afternoon sessions, and defined our risk. Action has now matured, and we got a break of support to the downside shortly after our analysis was published. Unfortunately, the breakout reversed, and we returned to trade within range, taking our stop out as it happened. To accommodate the most recent action, and as we set up against tonight’s late European session and Asian open, we’re going to tighten things up and go for a scalp target on either side of our breakout parameters. So, as always, get a quick look at the chart to see the levels that define our range. It’s a 15 minute chart that shows action from across the last (circa) 24 hours.
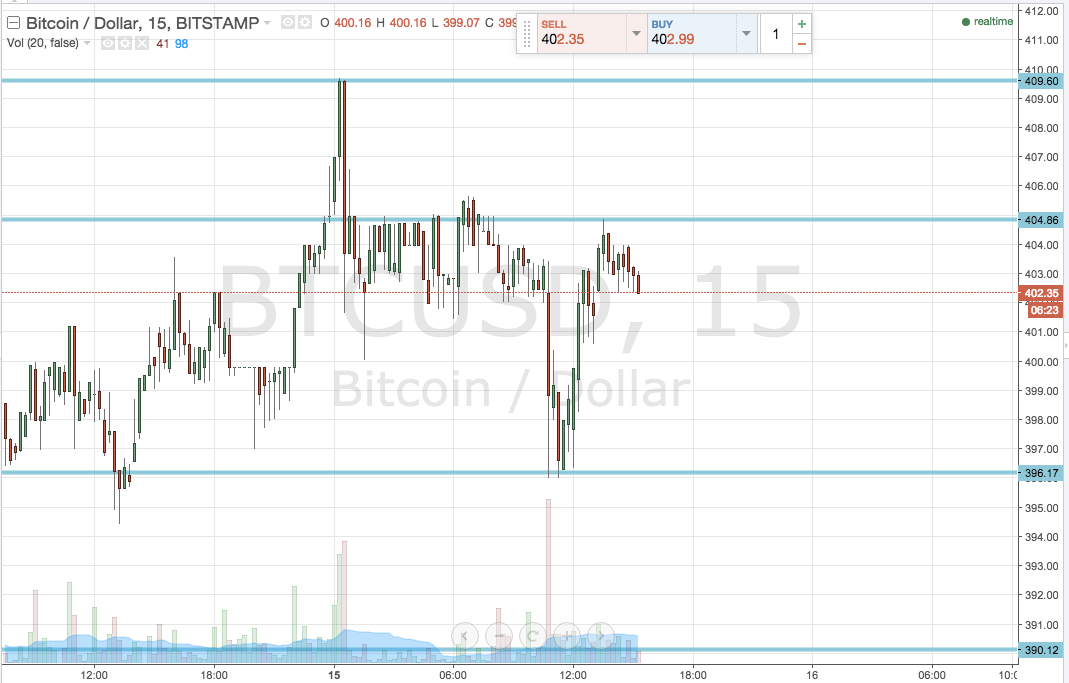

As the chart shows, we’ve tightened this afternoon’s range to be defined by in term support at 396.17 and in term resistance at 404.86. One thing to consider is that the psychologically significant 400 flat is bang in the middle of this range, so we might see some friction mid-range. It shouldn’t affect the breakouts, however.
So, looking to the upside, a close above in term resistance would put us in a long trade towards a tight upside target of 409.6. A stop somewhere in the region of 403.5 defines or risk on this one.
Looking the other way, if we get a close to the downside below in term support at 396.17, we will look to enter short towards 390 flat initially. We’ve got about six dollars’ reward here, so a stop around 398 keeps things tight from a risk perspective.
Final note – it’s a little tight for an intrarange strategy, and the 400 being mid range makes it even less attractive, so just breakout tonight.
Charts courtesy of Trading View.